Introduction
Structural/chemical changes induced by thermal and shear stresses during manufacture and shipping as well as potential interactions with various contact surfaces may lead to protein aggregation. Liquid formulations are generally at a greater risk of physical degradation. There are well-established bio-analytical techniques to analyze protein aggregation, but these are often time-consuming, complex and may require special handling of the samples. Spectroscopic methods such as FTIR, Raman and NIR are becoming more popular as the instrumentation becomes more robust and user-friendly with the evolution of process analytical technology (PAT) in pharmaceutical industry.
Although off-line Raman spectroscopic methods have been used to monitor structural/chemical changes of protein solutions [1,2], there are no published reports of the use of in-line Raman methods. Recently, aggregation of human insulin, a relatively moderate sized protein, was studied using an off-line Raman spectroscopy method [3], and the authors have also reported development of a multivariate calibration model for aggregation of human insulin under stress conditions. A similar approach is used in this study for a larger model globular protein.
Raman spectroscopy is a measurement of wavelength and intensity of inelastically scattered light from molecules. Raman scattered light occurs at wavelengths that are shifted from the incident light by the energies of molecule’s vibrations. Raman spectrum, like FTIR, provides information about the molecule’s structure and chemical composition. Although the mechanism of Raman scattering is different from that of infrared absorption, both Raman and IR spectra provide complementary information. Typical applications of Raman technique for analysis of protein molecules are: structure determination, qualitative and quantitative analysis of aggregation pathways etc. In-line Raman measurements using a probe provide a non-destructive technique and can be used for the analysis of both liquids and solid surfaces during the routine manufacturing process. The analysis doesn’t require preparation of sample; and it is insensitive to aqueous media. Previously, interference from fluorescence was a limiting factor for the use of Raman spectroscopy, however, recent advances in the technology such as better noise correction algorithms and effective use of data analyses, have essentially overcome this problem.
In this study, in-line Raman spectroscopy method was used with following specific objectives:
- Development of a calibration model for thermal aggregation of the model protein;
- Demonstrate feasibility of monitoring structural changes in the model protein molecule as a function of formulation and process variables.
Materials and Methods
Materials
A globular protein (molecular weight of 92000 Daltons, Isoelectric point of 5.9) in 10mM Phosphate buffer and 0.1M sodium chloride at a concentration of about 25 mg/mL and at pH 7.5 was used. All other chemicals (Sodium Hydroxide, Hydrochloric Acid, Sodium Phosphate, and Sodium Chloride) were laboratory grade and were purchased from Sigma-Aldrich.
Methods
A. Experimental Set-up

Figure 1 - Schematics of the Experimental Set-up
The experimental set-up consists of a 2-Liter glass jacketed reactor as shown in Figure 1. The reactor was equipped with an overhead stirrer, a temperature sensor, a pressure gauge and three sampling ports. Various formulation/process conditions were generated by changing the experimental parameters as described below:
- Effect of pH: Acid or alkali solution (1N HCl or 1N NaOH) were slowly (~ 0.1 pH unit change/min) added to the reactor containing 100 mL of the protein solution at pH 7.5. The target low and high pH for the resulting solution was 3 and 10, respectively. The solutions were then held at low and high pH values of 3 and 10 for approximately 6 hours at 5°C. Raman spectral data was collected during the addition step as well as during the hold time at each pH condition.
- Effect of High Temperature: Temperature of the protein solution inside the reactor was controlled by the jacket fluid temperature and was monitored by a temperature probe immersed in the protein solution. To study the effect of high temperatures on the aggregation behavior of the model protein, jacket fluid temperature was raised from 5°C to 60°C at a rate of ~0.3-0.5°C/min and then was held constant at 60°C for ~12 hours. Raman spectral data was collected during the temperature ramp as well as during the hold time at 60°C.
- Effect of Agitation Speed: The protein solution was subjected to shear by mixing at four different agitation speeds ranging from 100 rpm to 400 rpm (intervals of 100 rpm) while maintaining the temperature of the solution at 5°C. Agitation speed was held constant at each level for atleast 12 hours, and Raman spectral data was collected during the hold time.
B. Sample Preparation
No specific sample preparation was used for both Raman and size exclusion high performance liquid chromatography (SE-HPLC) analysis. Bulk solution at the same pH, buffering capacity, and concentration were used. Vehicle buffer was used wherever there was or a dilution step required. Required amount (to immerse the Raman probe in the vessel) of bulk solution stored at 2-8°C, was directly poured into the reactor which is protected from light during the course of experiment. Using sterile disposable syringes, 1 mL aliquots were extracted from the sampling port of the reactor at regular intervals for SE-HPLC analysis. The data was used to develop a calibration model as described in the data analysis section.
C. Raman Spectroscopy Set-up to Monitor Protein Aggregation
The Raman instrument used in this study was equipped with a charged coupled device detector (CCD) which enabled usage of appropriate exposure time for the sample due to their dynamic range. To minimize the impact of fluorescence and maximize sensitivity, a 785-nm excitation was used for the data collection. The system was equipped with a 1/2” diameter and 7” long immersion probe. Laser power was set at 100-120 mW throughout all the experiments. An exposure time of 30 sec was used to obtain a good quality signal and ‘signal to noise’ ratio was optimized during the data collection which was performed in a continuous reaction mode at a constant interval of 1 minute.
D. Monitoring of Aggregation by Size Exclusion Chromatography
Protein solution samples drawn at regular intervals from the reactor were analyzed for % aggregation level using SE-HPLC method. SE-HPLC separation was performed on a 7.8 mm x 300 mm TSK-3000 SWXL column equipped with a guard column and detection at 280 nm. The mobile phase consisted of 0.2 M KH2PO4, 0.9% NaCl and the flow-rate was maintained at 1 mL/min.
E. Data Analysis
Spectral data obtained in the above experiments was processed using standard chemometric techniques. The spectral data was corrected for baseline in the spectral region of 2000-450 cm-1 and a standard normal variate (SNV) algorithm was used to normalize the spectral signals. A partial least square (PLS) method was used to build a quantitative model using the spectral data (predictor - Y variable) and the reference aggregate compositions measured by SE-HPLC (response variable - X variable).
Results and Discussions
In Raman spectroscopy, a sample is illuminated with an intense beam of monochromatic light with frequency νincident followed by detection of various frequencies νi produced by inelastic scattering in the sample. The frequency shifts, Δν = νincident - νi, referred as Raman frequencies, correspond to normal vibrational modes associated with characteristic motions of diatomic or polyatomic groups of the scattering molecules. Laser Raman spectroscopy is particularly very useful for analyzing aqueous protein solutions, since the incident and detected radiations both fall in the visible light region with minimal interference from water absorption.

Figure 2 - Raman spectrum of the model protein solution
A typical Raman spectrum of protein provides valuable insight into tertiary structure, hydrogen bonding network, and side chain interactions of protein molecule, which all play a key role in protein stability and thus specific activity. These characteristics bands/regions are mainly due to the protein side-chain groups such as C=C, S-S, C-S, and S-H, which have higher polarizability since they are rich in π-electrons. Raman spectrum obtained for the model protein is shown in Figure 2. Some of the published literature [4,5,6,7,8] analyses were used to identify the characteristic or marker spectral regions for the model protein under study, and they are as follows:
Region I: 500-750 cm-1 corresponding to S-S or C-S stretching;
Region II: 830-930 cm-1 corresponding to Tyrosine Ring doublet;
Region III: 1020-1230 cm-1 Tryptophan Aromatic C=C, C=N stretching/backbone;
Region IV: 1200-1350 cm-1 Amide III;
Region V: 1570-1750 cm-1 Amide I.
1. Development of a Calibration Model for Thermal Aggregation of the Model Protein
Table 1 - % Aggregation obtained by SE-HPLC at various time-points during the thermal aggregation experiment
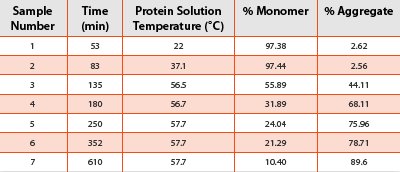
SE-HPLC analysis was performed at various time-points during the thermal aggregation experiment described earlier, and the results are presented in Table 1. Under the given experimental conditions, aggregation of the model protein was believed to be due to the irreversible unfolding of the native molecule followed by hydrophobic-hydrophobic interactions between two or more unfolded molecules to yield an aggregated product. During the experiment, the most sensitive changes observed were perturbations in the Raman signals from Tryptophan (Trp) and Tyrosine (Tyr) residues of the protein molecule. As aggregation level increased, intensity of these peaks decreased suggesting burial of these residues inside the core of the aggregated molecule as a result of increased hydrophobic-hydrophobic interactions.
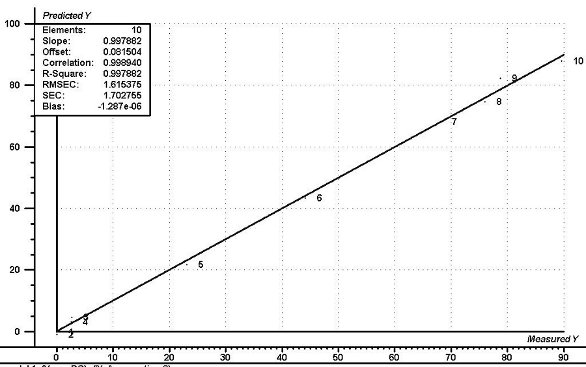
Figure 3 - PLS calibration model: “Predicted % Aggregation(Y)” vs. “Measured % Aggregation (X)”
A calibration model was developed using PLS regression algorithm which correlates the Raman spectra with the corresponding measured % aggregation by SE-HPLC. Even though, various spectral regions were used to build the quantitative model, data is presented for the best fit model using the specific spectral regions for Tryptophan C=C bond stretching (1040-1120 cm-1) and Amide I fingerprint region (1550-1750 cm-1) to predict aggregation in unknown samples. The PLS calibration model shows good linearity (Figure 3) with a slope of 0.9978 and a correlation coefficient of 0.99. Root Mean Square Error in calibration (RMSEC), which is a measure of average difference between predicted and measured % aggregation values, as shown in Equation 1, was approximately 1.6%.
RMSEC = √Σ (a predicted - a measured)2 / number of samples -1 (Equation 1)
To assess robustness of the model, leave one out cross validation (LOUCV) was employed using the same chemometric treatment as described earlier. As part of the LOUCV methodology, each sample was left out to construct a new calibration model which was used to predict the % aggregation level of the left out sample. A linear relationship was established within the validation data set for each sample with a slope of 0.9456, intercept of 1.2% and correlation coefficient of 0.9632. Root Mean Square Error in validation samples (RMSEV), which is a measure of predictive ability of the calibration model, was approximately 4.7%.
2. Demonstrate Feasibility of Monitoring Structural Changes in Protein Molecule as a Function of Formulation and Process Variables
- Effect of pH
Very often, pH adjustment step is employed during routine manufacturing process, and in-spite of a robust process control, it may involve multiple additions of alkali or acid solutions to achieve the desired pH. The experimental conditions described earlier were designed to simulate various processing scenarios during such a pH adjustment step and also to establish the process boundaries for allowed exposure to acidic and basic conditions during the addition step. Under the experimental conditions studied, no visible changes in the Raman spectra were noticed for the protein, indicating no degradation as a result of exposure to high and low pH conditions for 6 hours at 5°C. This observation was confirmed by performing SE-HPLC analysis on the samples obtained at the end of exposures to low and high pH conditions.
- Effect of High Temperature
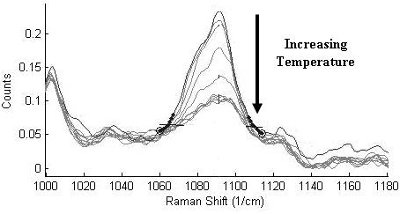
Figure 4 - Disappearance of Tryptophan C=C and C=N vibration intensities due to thermal aggregation
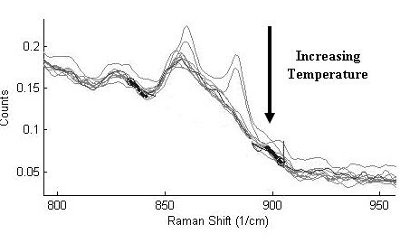
Figure 5 - Disappearance of Tyrosine doublet intensities due to thermal aggregation
The Raman spectral data collected during the temperature ramp from 5°C to 60°C and the subsequent hold at constant temperature of 60°C, showed gradual change in the spectral profile - predominantly decrease in Tryptophan C=C and C=N vibration intensities (Figure 4), and Tyrosine doublet intensities (Figure 5). There was also significant reduction in the peptide backbone intensities with an increasing temperature (data not shown). Based on the qualitative features of the spectral data, it was speculated that nonpolar residues such as Tryptophan and Tyrosine are buried in the interior of the protein structure as the backbone changes its conformation in response to higher temperatures. The spectral profile also shows that there is a rearrangement of peptide backbone, leading to reduced Raman intensities of the corresponding fingerprint region (1020-1230 cm-1).
In a typical Raman spectrum of a protein molecule, both polypeptide backbone and side chain frequencies can be used to assess changes in tertiary structure as a result of external stress conditions. The changes in the side chain spectral features can mainly be used to assess the hydrogen bonding network, local environment, and inter- or intra-molecular interactions of protein molecule. For α-helix configuration of protein, Amide I band occurs at ~1655 cm-1 due to the C=O stretching and Amide III band appears between 1250-1235 cm-1. While, for β-sheet configuration of protein, Amide I band occurs at ~1670 cm-1 and Amide III band occurs at 1340-1300 cm-1.
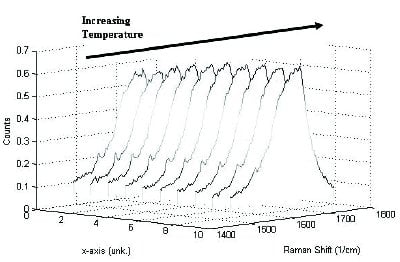
Figure 6 - β-Sheet configuration of the model protein molecule (Amide I band at ~1670 cm-1)
Figure 6 shows broad peak at ~1670 cm-1, indicative of high β-sheet content of the model protein, and it increases in intensity as the temperature is increased implying that structural changes of the protein may have a positive impact on protein-protein interactions leading to aggregation. Unfortunately, quantitative analysis in this region is hindered due to a substantial water overlap.
- Effect of Agitation Speed
Depending upon the properties of protein molecule and its formulation composition, protein may undergo aggregation when subjected to shear stress. Therefore, it is essential to establish the boundaries for allowable shear stress during manufacture and handling of protein solution. As described earlier, the agitation experiment was designed to simulate an exposure to medium to high shear forces by varying the agitator speed and time within a typical acceptable range at the manufacturing scale. For the entire duration of 12 hours and at all the agitation speeds ranging from 100 rpm to 400 rpm, no visible changes in the Raman spectra were observed. This clearly indicates higher conformational stability of the model protein to agitation, and thus also indicating no aggregation under the experimental conditions studied in this work. This observation was confirmed by performing SE-HPLC analysis on the samples obtained at the end of exposure to each agitation condition.
Conclusion
This study demonstrates feasibility of using in-line Raman spectroscopy method for monitoring aggregation of therapeutic proteins as a function of formulation and process variables - especially in the cases where soluble protein aggregates are formed. The use of Raman spectroscopy as an in-line and non-destructive technique is quick and yields valuable information about protein stability, especially for the aggregation. Robustness of this technique can be substantially improved by combining this analysis with various other bio-analytical techniques. This technique is also expected to be useful for direct analysis (without prior dilution) of relatively concentrated protein solutions (up to 100 mg/mL). The Raman spectroscopy method offers user-friendly approach for a fast and efficient development of protein based products and processes.
References
- Sane S., Wong R., Hsu C. Raman Spectroscopic Characterization of Drying-induced Structural Changes in a Therapeutic Antibody: Correlating Structural Changes with long-Term Stability. J. Pharm. Sci., 2004. 93(4): p. 1005-1018.
- Hedoux A., Ionov R. Evidence of a two-stage thermal denaturation process in lysozyme: A Raman scattering and differential scanning calorimetric investigation. J. Chem. Phys., 2006. 124(1): p. 14703-14709.
- Gryniewicz C. M., Kauffman J. F. Multivariate Calibration of Covalent Aggregate Fraction to the Raman Spectrum of regular Human Insulin. J. Pharm. Sci, 2008. 97(9): p. 3727-3734.
- Carew E. B., Asher I. M., Stanley H. E. Laser Raman Spectroscopy - New Probe of Myosin Substructure. Science, 1975. 188: p. 933-935.
- Frushour B. G., Koenig J. L. Raman Studies of the Crystalline, Solution, and Alkaline-Denatured States of β-Lactoglobulin. Biopolymers, 1975. 14: p. 649-662.
- Thawornchinsombut S., Park J. W., Meng G., Li-Chan E. C. Y. Raman Spectroscopy Determines Structural Changes Associated with Gelation Properties of Fish Proteins Recovered at Alkaline pH. J. Agric. Food Chem., 2006. 54 (6): p. 2178–2187.
- I. Notingher Raman Spectroscopy Cell-based Biosensors. Sensors, 2007. 7: p. 1343-1358.
- Wen. Z-Q. Raman Spectroscopy of Protein Pharmaceuticals. J Pharm. Sci., 2007. 96 (11): p. 2861-2878.
Author Biographies
Dr. Amol Mungikar is a Senior Research Investigator at Bristol-Myers Squibb, New Brunswick NJ. He has 5 years of experience in the pharmaceutical industry. In his current position, Amol is involved in development of parenteral formulations for both small and large (protein) molecules and also scale-up and technology transfer of the drug product manufacturing processes. Recently, Amol has also contributed significantly to the marketing applications of protein based drug products. He received his Ph.D. degree in Chemical Engineering from University of Missouri-Rolla in 2005. His current research interests include lyophilization, development of novel protein formulations, development of nanosuspensions formulation, development of spectroscopic techniques for protein analysis, mathematical modeling of protein aggregation phenomenon, and scale-up and technology transfer of complex manufacturing processes.
Dr. Madhav Kamat is a Research Fellow at Bristol-Myers Squibb Company, New Brunswick, NJ in its Aseptic Technology Group. Dr. Kamat has a significant experience in product/process development (small molecule and biologicals) of over 20 years involving formulation development, scale-up/technology transfer, process validation, and sterile manufacturing of more than 20 injectable products. He is well recognized for his expertise in the lyophilization, nanosuspension technology, pharmaceutical isolators processing, aseptic technology, and other sterile manufacturing processes. He is active in various initiatives by US-FDA and American Association of Pharmaceutical Scientists (AAPS). His recent interests are formulation and process development of IV injectable products of water insoluble drugs. Dr. Kamat received his B. Pharm and M. Pharm from Bombay University and Ph.D. from the College of Pharmacy at University of Kentucky, USA. Before joining Bristol-Myers Squibb Company in 1995, Dr. Kamat worked at Centocor and Johnson & Johnson. Dr. Kamat is a Registered Pharmacist in the States of Pennsylvania and New Jersey.
This article was printed in the November/December 2010 issue of American Pharmaceutical Review - Volume 13, Issue 7. Copyright rests with the publisher. For more information about American Pharmaceutical Review and to read similar articles, visit www.americanpharmaceuticalreview.com and subscribe for free.