Ablatt Mahsut Global Product Science Lead, Takeda Pharmaceutical Company
Piyush Jain Associate Director Downstream Manufacturing, Takeda Pharmaceutical Company
Matt Diamond-Jones Operations Project Manager, Takeda Pharmaceutical Company
Donald Gillies Principal Scientist, Analytical Development, Takeda Pharmaceutical Company
Nigel Herbert Bioanalytics Applications Specialist, Repligen Corporation
Abstract
Conventional spectroscopy is typically based on a fixed 10 mm pathlength measurement. Due to the fixed nature of the pathlength, conventional spectrophotometers have a limited dynamic range and are unable to accurately measure wide concentration ranges without diluting the sample to the linear range of the instrument. In this study, gold nanoparticles in downstream bioprocessing are determined utilizing the CTechTM SoloVPE® System with variable pathlength technology to perform the Slope Spectroscopy® method. The results obtained from the SoloVPE System are compared to the results obtained from the conventional spectrophotometer to assess the suitability and utility of the Slope Spectroscopy method. Viral filtration measurements are assessed to demonstrate the comparability between the SoloVPE System and the conventional spectrophotometer in downstream bioprocessing.
Introduction
Viral filtration is a size-based removal method that uses a membrane to retain virus particles during production of biologic products, while allowing the product to pass through the filter. Confirmation of filter integrity as part of in-process testing is critical to ensure filter effectiveness. The gold particle test (GPT) is one of the most common and effective ways to perform post-use integrity testing of Planova filters. GPT is used to confirm that there is no shift in pore size distribution after virus filtration. A gold particle solution matched to the Planova filter type (e.g, Planova filter, 20N) is passed through the filter. Ultraviolet-visible (UV-Vis) spectroscopy at A520, A526, and A530 is used throughout filtration to quantify the level of gold particles pre- and post-filtration. These readings are then used to calculate virus removal capability as shown in Figure 2, where the acceptance criteria is set to φ < 1.40.
Traditional UV-Vis methods rely on fixed-pathlength absorbance readings which can lead to assay error. Because of the high concentration of gold particles, each sample requires substantial serial dilution to be measured within the linear range of the instrument. This can produce up to 30% error in the optical density reading, which can call the validity of the method into question.
In the past several years, the SoloVPE variable pathlength system has become an increasingly popular technique for concentration measurements in pharmaceutical laboratories due to its fast analysis speed and large dynamic testing range. Instead of relying on a single absolute absorbance value, the SoloVPE utilizes the Slope Spectroscopy method which allows the system to create section data based on the collected absorbance values per pathlength. The Slope Spectroscopy method is an analytical manipulation of the Beer-Lambert Law that generates slope values to acquire sample concentration. Beer’s law is expressed as A = ε • l • c where A is the measured absorbance, ε is the molar absorption coefficient, l is the pathlength, and c is the concentration of the sample. To enable the Slope Spectroscopy equation, the pathlength term l is moved to the left side of the equation where A/ l = ε • c. The A/ l term is the change in absorbance per change in pathlength, which is also known as the slope m of the equation. This substitution results in the Slope Spectroscopy equation which can be expressed as m = ε • c. The slope is the most critical value within the equation, as it allows us to determine the sample concentration or molar absorption coefficient.

The SoloVPE System measures absorbance values at varying pathlengths very quickly and precisely. It operates by first defining the pathlength range necessary for the sample. This is the distance between the bottom of the CTechTM Fibrette® Optical Component, where the light emits, and the bottom of the sample vessel. The integrated hardware and software allow the SoloVPE System to precisely move the Fibrette component up and down from 5 mm to 15 mm of pathlength, with a resolution of 5 μm steps (Figure 1). The linear regression coefficient (R2) of the measurement verifies the validity of the measurement. Values close to one confirm a strong correlation with Beer’s law by demonstrating that the absorbance values change proportionally with the pathlength values. As a result, wide ranges of concentrations can be measured easily without extensive sample preparation and dilution.
This paper demonstrates that the SoloVPE System using the variable pathlength technique can be used to replace the traditional UV-Vis-based gold particle test to support filter integrity testing during the viral filtration step of downstream biologics manufacturing.
Materials and Methods
Methods
The materials and consumables used to perform the verification of the GPT method are listed below. The required sample volume is inversely related to the sample concentration. To account for the trace amounts of gold nanoparticles in the viral filtrate, the large fused silica vessel was used for each measurement. GPT solutions were provided by Asahi Kasei in the form of an AGP-HA20 kit while the SoloVPE System and associated consumables were provided by Repligen.
- SoloVPE instrument [Part No. SYS-VPE-SOLO5]
- Cary 60 UV-Vis spectrophotometer [Part No. IN-CARY60 or Agilent Part No. G6860A]
- Fibrette optical component [Part Nos. OF0002/(50 Pack) OF0002-P50]
- Fused silica vessel—large [Part No. OC0005-2]
- Sample vessel holder—large [Part No. HM0190]
- Planova 20N fi lters (Asahi Kasei) [Part No. AGP-HA20 kit]
- GPT solution [Part No. AGP-HA20 kit]
- Water for injection (WFI) [Internal Part No.]
- GPT dilutions prepared for linearity testing [prepared in the lab]
Methods
The GPT standard was first measured neat on the SoloVPE System. The Slope Spectroscopy method allows the SoloVPE System to measure the standard undiluted. In order to measure the standard on traditional UV-Vis systems, the standard must be diluted. Therefore, GPT stock solution (1:10 dilution) was prepared using 0.27% (w/v) sodium dodecyl sulfate (SDS). Dilutions were made with WFI and the samples were measured by filling a large fused silica vessel with ~2.5 ml of volume. The stock solution was also used to quantify the pre- filtrated GPT solution by measuring the slope value. The same analysis was performed for the WFI as well as the post-filtrated GPT solution. The pre-filtrated solutions were measured in triplicate using the MultiQ-M feature with WFI as the baseline correction. The three wavelengths of interest for this solution are 520 nm, 526 nm, and 530 nm where 526 nm is the lambda max. The software can calculate the A530/ A520 ratio and measure the three wavelengths of interest simultaneously within one run. The stock solution slope values were multiplied by 10 to convert to an absorbance value at 1 cm pathlength. The results from the pre- and post-filtrated solutions were used to calculate the gold particle removal rate. A comparability study between traditional UV-Vis spectroscopy and SoloVPE variable pathlength spectroscopy


was also performed to compare the results of the two methods. The WFI, pre-filtrated GPT solution, and post-filtrated GPT solution were each tested in eight replicates. The equations can be seen below in Figure 2, and the acceptance criteria for the measurements can be seen within each table.
Results
Validation of SoloVPE System-Based Gold Nanoparticle Test
In this report, the neat gold particle solution, pre-filtrate (1:10), 1:100, 1:250, 1:500, and 1:1000-fold diluted gold particle solutions were used to validate filter integrity testing of Asahi Kasei Planova filter 20N with the SoloVPE System. Method specificity, accuracy, repeatability, linearity, limit of detection, and gold particle removal rate capability were demonstrated. Each test solution was measured in multiple replicates, using the plastic vessels with 120 microliters of volume and the large fused silica vessels with 2.5 ml of volume. The results were evaluated against the acceptance criteria shown in each of the validation sections below.
Specificity
The specificity was evaluated by testing the GPT solution with and without baseline correction. The results show that the GPT solution generates robust response for all three wavelengths and the absorbance readings meet the acceptance criteria as shown in Table 2. All blank readings show no absorbance, meaning there is no interference from the blank on the absorbance of the GPT solution. Therefore, the method is considered specific for the measurement of the GPT solution.
Instrument Precision (Repeatability)
The repeatability was demonstrated for the instrument and the method separately. The instrument precision was demonstrated by measuring six replicates of the same sample. The testing was performed using the neat GPT solution. The criterion for success was that the %CV be ≤ 2.0 %, the R2 ≥ 0.999, and the slope values at the 520 nm, 526 nm and 530 nm wavelengths are met for individual observations as well as the average. The instrument precision results met the acceptance criteria demonstrated in Table 4.

Method Precision (Repeatability)
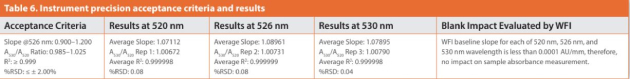
The method precision was evaluated by testing three replicate preparations of the GPT solution without dilution. The testing was performed using the neat GPT solution. The criterion for success was that the %CV be ≤ 2.0%, the R2 ≥ 0.999, and the slope values at the 520 nm, 526 nm, and 530 nm wavelengths are met for individual observations as well as the average. The results show that the results from three replicate preparations of the GPT solution yield robust response for all three wavelengths and the resulting absorbance readings met the acceptance criteria demonstrated in Table 6.
An intermediate precision study was not required to assess intra-lab and intra-analyst variability associated with the method. Based on the performance of the single analyst and single instrument results, it is expected that the variability associated with a different analyst and a different instrument remain low for this method. The results from both, instrument and method precision, show that the method is precise to be used for gold particle testing to support filter integrity testing.
Linearity
The linearity was assessed by analyzing different concentrations of the gold particle solution. The solutions were prepared in SDS buffer per dilution instructions provided by Asahi Kasei. To maintain consistency with the traditional UV-Vis method, WFI correction was incorporated as part of the linearity. The linearity data is demonstrated in Table 7 where the observed concentration is the average of three measurements.
The GPT concentrations that were measured were neat, 1:10, 1:100, 1:250, 1:500, and 1:1000-fold diluted. The criteria for success is that the R2 of the average of three reportable gold particle concentrations is ≥ 0.999.
The absorbance results at the 520 nm, 526 nm, and 530 nm wavelengths for the 1:1000 dilution fell a little outside the acceptance criteria. Also, the coefficient of variation at the 530 nm wavelength was a little higher than 2%. This was due to the very low concentration of the gold particle solution, where the 1000-fold dilution is considered the lowest amount of gold particle that can be accurately quantified by this method.


The results of the linear regression analysis (Figures 3–5) show that the R2 for all fi ve dilutions is one with a slope between 1.05–1.08, thus meeting the target criterion. From the results, the method is found to be linear between 1:1000-fold concentration to nominal concentration of the gold particle solution (A526 0.900–1.200).
Accuracy
Accuracy of the gold particle test was inferred from the precision, linearity, and specifi city. Each criterion for the precision, linearity and specifi city was met. In addition, all results from the precision and linearity were within specification criteria per the Asahi Kasei gold particle test kit. Therefore, the method is considered accurate for gold particle measurement in support of filter integrity testing.
Limit of Detection
According to Asahi Kasei, instrument sensitivity is critical for accurately measuring the gold particle removal rate of the Asahi Kasei Planova filter. WFI signal at A526 must be ≤ 0.001 Abs/10 mm in order for the gold particle method to be suitable for filter integrity testing. Gravimetric spectroscopy of gold particles ensures the instrument is pre-blanked with WFI prior to measuring the WFI signal. To maintain consistency with the gravimetric method, the SoloVPE instrument was baseline corrected with WFI prior to taking measurements. This is to ensure that the instrument was properly baseline corrected to account for any background signal that will impact the WFI reading. To qualify that the SoloVPE instrument met WFI acceptance criteria, replicate measurements were performed on six independent preparations of WFI. The results are presented in Table 8. To report slope (Abs/mm) in Abs/cm, the SoloVPE instrument results were multiplied by 10 prior to being compared to WFI acceptance criteria. The criteria for success is that the WFI A526 signal from six replicate measurements are ≤ 0.001 Abs/10 mm. As shown in Table 8, all WFI results obtained by SoloVPE instrument met WFI acceptance criteria.


Comparability Testing Validation
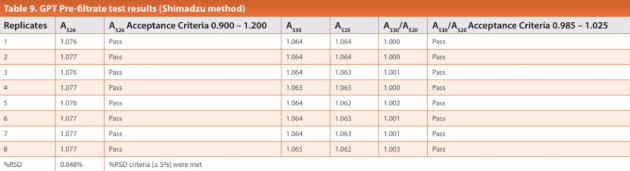
Comparability of the traditional spectrophotometer (Shimadzu UV- 1800) and the SoloVPE System was evaluated by performing side-by-side testing of the WFI, pre-filtrated GPT solution, and post-filtrated GPT solution. A comparative testing for WFI, pre-filtrated GPT solution, and post-filtrated GPT solution was performed in eight replicates for a total of 48 samples where 24 sample results were performed via gravimetric method and 24 sample results were performed via Slope Spectroscopy method. To avoid introducing additional variables, all data presented for each method were performed by a single analyst on the same day. The results are presented in Table 9 through Table 11.
The gold particle removal rate was determined using the results from the WFI, pre-filtrate, and post-filtrate measurements. The gold particle removal rate is calculated per equation, φi = Log 10 (A/(G-F-E)).


- A = A526 of gold particle solution
- G = A526 of gold particle solution flow through
- F = Apvp per CoA provided by Asahi Kasei (per CoA, the kit used for comparability has Apvp value of 0.000 Abs/mm)
- E = A526 of WFI reading per specification in Table 6
A, G, F, E terms represent corresponding measurements performed for each method.
The % difference between gold particle removal rates for the two methods was calculated using the following equation:

The percent difference between the gold particle removal rate averages of both systems was 4.1%. All individual gold particle removal rate results met Asahi Kasei gold particle removal criteria and can be seen in Table 12. The results show that all the pre-defined acceptance criteria for pre-filtrate A526, A530/A520, WFI, post-filtrate, and gold particle removal rate were met.
Discussion
As shown in specificity and sensitivity check results, all measured WFI results are below specified criteria of 0.001 Abs/10 mm. The data further demonstrates that the SoloVPE instrument is capable of measuring gold particle solution within the sensitivity specification of ≤ 0.001 Abs/10 mm defined by Asahi Kasei.
The SoloVPE System results showed accurate measurements throughout the dilution series. The acceptance criteria for the 1:250 dilution was close to the instrument tolerance, which suggest that more sample volume was required to bring the reading in the mid-range of the specification. When using the large fused silica vessel, 2.5 mL of sample will fill the max pathlength. The 1:1000 dilution was out of the absorbance range of the system.
Based on the validation results, the fused silica vessel with 2.5 mL of volume, is recommended for WFI, pre-and post-filtrate GPT solution testing.
Both pre- and post-filtrate solutions were evaluated based on the specification established by Asahi Kasei. The pre- and post-filtrate results along with WFI (Awm of 526) and Apvp values were used to calculate the gold particle removal rate, φ. All gold particle removal results for six replicate measurements met the acceptance criteria of φ < 1.40. To maintain consistency with gold particle measurement procedure on traditional fixed-pathlength spectrophotometer, it is required that the baseline correction with WFI be performed prior to measuring blanks, pre- and post-gold particle filtrate solutions.
Conclusion
This paper demonstrates the suitability and utility of applying the SoloVPE System in place of traditional spectrophotometers for supporting in-process viral filtration integrity tests. With the passing of all predefined acceptance criteria, it is concluded that the SoloVPE instrument is capable of measuring the gold particle solution within specified accuracy, repeatability, specificity, and linearity. Furthermore, the baseline correction results show that the SoloVPE System has sufficient sensitivity to measure gold particle solution to support Planova filter integrity testing.
Acknowledgments
Joe Ferraiolo, Associate Director, Bioanalytics Applications, Repligen Corporation
Michael Gramer, Head of Global Manufacturing Science, Biological Product and Process Sciences, Takeda Pharmaceutical Company
References
- Zhen Tong, Juma Bridgewater, and Nuria de Mas. Viral Nanofilter Integrity Using Variable- Pathlength UV-Vis Spectroscopy for the Gold Nanoparticle Test. Bristol Myers Squibb.: Devens, MA, 2019; https://bioprocessintl.com/downstream-processing/filtration/viral-nanofilter- integrity-using-variable-pathlength-uv-vis-spectroscopy-for-the-gold-nanoparticle-test/
- TAS33031, version 3.1: Standard Operation Procedure for Integrity Test: GPT (AGP-HA). Asahi Kasei Medical Co., Ltd.: Tokyo, Japan, 25 February 2019.
- Ferraiolo Joe, Shanbaky Ramsey. Characterization of Gold Nanoparticle Detection Using Slope Spectroscopy (SoloVPE Variable Pathlength UV). Repligen Corporation: Bridgewater, NJ, 2017;
Subscribe to our e-Newsletters
Stay up to date with the latest news, articles, and events. Plus, get special offers
from American Pharmaceutical Review – all delivered right to your inbox! Sign up now!