DISCLAIMER: This publication was developed before the publication of technical details on low-pressure Hydrogen Peroxide sterilization. That process is significantly different from the near-ambient pressure vapor processes discussed herein, and extending the concepts described to that process is not appropriate. The aerosol introduction of H2 O2 for decontamination is also different in execution and is excluded as well.
Hydrogen Peroxide (H2O2 ) has played an increasingly prominent role in the global healthcare industry for the treatment of environments, materials, and equipment since its introduction in the late 1980s. Delivered in a variety of means, loosely termed Vapor Phase Hydrogen Peroxide (VPHP) treatments, it offers advantages over other methods due to the absence of significant residues and a broad spectrum of activity. Vapor phase H2O2 processes of virtually identical design have been termed as either decontamination or sterilization, depending largely upon the writer’s preference. This document is intended to address inconsistent performance in both, and further distinction will not be made within this manuscript when describing a vapor H2O2 process.
Gases, Liquid and Vapors
To better understand vapor phase hydrogen peroxide processes, it is critical to understand the relationship between gases, liquids, and the often-misunderstood vapors (or vapors). A vapor is a gas at a temperature below its critical temperature.1 That means that it is in equilibrium with its liquid phase. As such, it can condense into the liquid
phase by either increasing the pressure or reducing the temperature.
The concentration of the substance in the gas phase x1 follows Dalton’s Law:2
p = p1 + p2 ………pn
and
xn = pn /p
Where:
p = total pressure of the system
pn = partial pressure of the substance in the gaseous phase
Xn = mole fraction of substance in gas
The partial pressure of any substance in the gas phase is equal to its equilibrium vapor pressure in the liquid phase according to Raoult’s Law:2
pn = yn × p0 n
Where:
yn = mole fraction of the substance in the liquid phase
p0n = vapor pressure of the substance; depends on temperature
These relationships and an understanding of the physical properties of the substance being studied, in this case, hydrogen peroxide, may be applied to determine the concentration in both liquid and gas phases in equilibrium, provided the temperature and pressure are known. This is important because in the vapor systems, both phases are present, and lethality within each phase will be different.
A vapor can be created by cooling a hot gas-liquid mixture below the liquid’s boiling point or by spraying liquid droplets into a gas. Depending upon the amount of H2O2, either condensed or remaining in the liquid state, it may not be visible to the unaided eye (also termed micro-condensation).3
When we look at a cloud, we see a white liquid (water) suspended in the air in equilibrium with water vapor,r, which remains in the gas phase. Change the temperature and the size/density of the cloud changes as well. When the cloud is heated, it slowly disappears as the liquid droplets evaporate and become too small to be visible. Heat the cloud further, and the liquid present converts to the gas phase. The evaporative process is fully reversible by reducing the temperature of the system.
The delivery of hydrogen peroxide as a decontaminant and sterilant relies on these same phenomena. Solutions of H2O2 in H2O are heated to their boiling point and introduced into a dry air stream. The hot vapor is introduced into the ambient temperature target environment directly or through a HEPA filter. Depending upon the temperatures, dry airflow, target volume,e and amount of solution vaporized, condensation will occur, which may or may not be visible. In vapor processes, the vapor is initially heated to ensure that the liquid H2O2 and H2O are fully converted to the gas phase, and then the heated vapor is introduced into the target system. The temperature of the system (ordinarily, vapor processes are executed at ambient temperature or slightly above) will increase significantly only in the smallest of enclosures. Nevertheless, the temperature in the system will vary both within the environment and throughout the process. All vapor systems, regardless of the specific process design, share some common elements:
- Regardless of their apparent appearance, two phases may be present.
- The processes will not reach steady state conditions across the system while the introduction of the heated gas continues. In many systems, H2O2 introduction is continuous during the conditioning and exposure period.
- Concentration, relative humidity, and temperature are not constant across the system and during the process.
- The concentration of H2O2 and H2O in each phase varies across the system throughout the process due to localized variations in phase, temperature, and relative humidity.
- Because these variations are difficult (if not impossible) to measure, the process cannot be precisely defined by physical measurements.
- The phase and conditions where microbial kill is achieved are unknown.
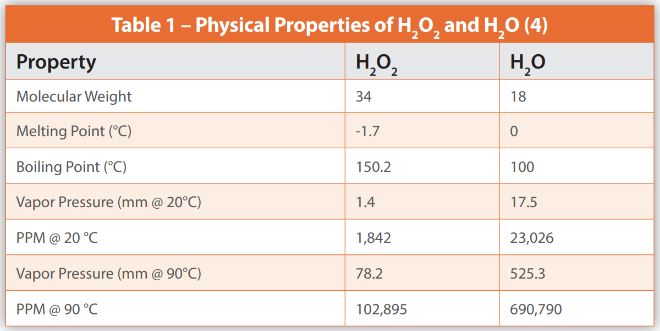
Corresponding differences in process lethality are inevitable as a consequence of the unavoidable variations in conditions within the systems. Physical properties play a critical role in vapor processes. Table 1 includes some of the important properties of H2O2 and H2O which impact its delivery and use.
D-Values in Sterilization
It is useful to understand some of the general principles behind sterilization before considering the adaptations necessary for H2O2 vapor processes. An essential part of microbial kill is the determination of a D-value, as this allows for the calculation of the duration of the process dwell period. The D-value is the period (usually in minutes) required to reduce the microbial population by 1 logarithm (or 90%) and must be linked to specified lethal conditions at the challenge indicator location (see Figure 1).5 As a change in the conditions of exposure will result in a different rate of kill (a different slope of the death curve shown in Figure 1), the conditions must be accurately determined.6
Thermal Processes
In thermal processes, D-values are easily determined,d with temperature the only process variable affecting lethality. The D-values for the thermal process are reported as a DT where T is the temperature at which the study is performed. If the D-value is assessed at varying temperatures, the z-value (the number of degrees that result in a ten-fold change in the D-value) can be estimated, allowing for estimated lethality calculations based upon the varying exposure temperatures in real-world processes. This is necessary as the exposure conditions in routine use of thermal processes are rarely constant. The z-value is only relevant to thermal processes. The mathematical estimation of process lethality is only practical with thermal processes due to the singular relationship between temperature and microbial death.
Gas and Liquid Processes
D-value determinations can be made for gas and liquid sterilization processes, albeit with some expansion to the methodology. The rate of kill (or death curve) for these is influenced by more factors than for the thermal process. For gas processes, the gas concentration, relative humidity (RH), and temperature determine the rate of kill and must be listed with any reported D-value. Real-world gas processes typically have comparatively stable conditions over their duration and throughout the closed systems in which they operate. However, D-values for gas sterilization processes are commonly used only as a starting point in establishing process dwell This lack of an accurate lethality calculation encompassing concentration, RH, and temperature variations has resulted in the widespread use of the ‘half-cycle’ approach for validation. “Half-cycle” indicates a process that has been shown to inactivate specific biological indicators having a population of 106 spores per unit known to be resistant to the sterilization method. The duration of the cycle is then doubled in routine use to provide a greater than 12 log reduction in the biological indicator population that provides an added margin of safety.
In liquid sterilization, D-value estimation is more reliable as agent concentration and temperature are the only process variables, relative humidity not being a factor in aqueous solutions. This greatly simplifies dwell time establishment and process execution.
Vapor Processes
Recalling the unavoidable phase and concentration variations in process conditions associated with vapor processes, the ability to establish a proper D-value is compromised because the phase present at the point of kill is unknown. Thus, concentration and relative humidity are indeterminate as well. Absent a D-value, the conventional methods for the establishment of process dwell are inadequate.7,8,36
Many BI manufacturers include a ‘D-value’ with their biological indicator documentation as a convenience to customers. These are not true D-values as they are not based on exposure conditions but rather on injection rates or other measures of vapor H2O2 introduction.5,7,8 Converting these ‘D-values’ for use in a users’ system of different dimensions, concentration, temperature, and humidity makes these unsuitable as anything other than a means for comparison between different lots made by the BI manufacturer in their test system. As such, they may have some limited utility. The manufacturers ‘D-value’ should never be used for estimation of process dwell in the users’ system.
The cycle development process is further complicated by the inescapable variations in process conditions within any vapor system,m regardless of its application. The absence of uniform conditions and the consequential inability to identify the “worst case’ location within the system adds further complexity. Real-time analytical methods are of limited use in two-phase systems, especially where conditions vary across the target environment. Concentration measurements in the gas phase (which are more easily obtained) provide minimal information regarding concentrations in any condensed liquid. While the ISO 18472 BIER standard includes recommendations for a vapor phase hydrogen peroxide resistometer, there is no documented evidence that a system conforming to the standard is replicative of the typical conditions of vapor processes in contemporary use. i,6
The existence of a global standard defining the performance requirements for biological indicators, including vapor phase hydrogen peroxide, suggests that D-value determination is possible.6 Despite the existence of the standard, the global H2O2 biological indicator manufacturers do not always provide D-values conforming to that standard because suitable BIER vessels are not widely available. In any case, given the dual-phase nature of the vapor process and the absence of a relative humidity requirement, it is unclear whether the standard provides a reliable means of resistance determination. Suppose a two-phase system is present. This will likely be the case in every installation,; its utility is even less certain.
A suggested solution to the inability to use the vendor’s D-value in the user’s system is the determination of a ‘system D-value.’9 The assumption is that by using the user’s system to estimate the ‘system D-value,’ the unavoidable differences between the BI manufacturer’s test system and the user’s system are eliminated, and more suitable results are obtained. Thi, too, is fallacious, as the conditions across the user’s system, which is substantially larger than the typical BI manufacturer’s test system, are even more variable, and the ‘system D-value’ cannot reliably predict what occurs at each location or within the overall system. Accurate D-value determination requires replicate exposures at known constant conditions.6,7 Neither of these requirements is present in large-scale vapor systems.
“Resistometers differ from conventional sterilizers. Instrumentation selection and control requirements for resistometers are based on mathematical models in which rates of reaction, measurement accuracy, and process control requirements are evaluated to quantify the effects induced by test equipment-controlled variables. The requirements for accurate measurement, precise control, and rapid rates of change approach limit commercially available process control and calibration instrumentation accuracy. The measurement and control requirements often prohibit practical validation of a resistometer using procedures that might be employed in a conventional heat or chemical sterilization system.”6
The use of ‘system D-values’ should be recognized as a failed attempt to adapt the processing conditions associated with pure gases to a multi-phase vapor system with its unavoidable complexities. The dependency of vapor systems on multiple physical parameters prevents any useful application of this approach in determining resistance in multi-phase systems.
Process Development
Process Uniformity
In sterilization processes, it is desirable to deliver near-constant conditions across the entire load/system to increase process reliability. This is typically confirmed in studies in which essential parameters such as agent concentration, RH, and temperature are evaluated across the empty target vessel or environment to ensure uniformity during the entire dwell period. This is easiest with steam processes and somewhat less so with dry heat. Pure gas and liquid processes can benefit from the use of agitation, which improves uniformity across the chamber. Not all vapor processes employ vigorous agitation, and some even employ unidirectional air within the system, minimizing any mixing potential. The presence of multiple phases, varying temperatures across the system, and the absence of robust mixing precludes any ability to deliver near-uniform conditions throughout the system and process.
It is important to understand that it is extremely difficult for a vapor system to achieve uniform conditions throughout. Nevertheless, the system should be designed to ensure that conditions at any individual location will be consistent from cycle to cycle. This is accomplished by controlling the environment’s temperature and relative humidity to prevent variations.
Defining Process Duration
Only with knowledge of the expected D-value for a biological indicator can the process dwell be established with confidence. The time required to fully inactivate the challenge microorganisms can be estimated, and a sufficient safety margin can be added to ensure process robustness. This is true for all thermal, pure gas, and liquid processes when using the D-value information for the chosen biological indicator. It is not possible for vapor processes, given the absence of definitive microbial resistance information and the variability of the processes themselves (see Table 2). The uniqueness of vapor processes makes their implementation more complex than other sterilization methods.
Scientific Realities with Vapor Processes
Despite the obstacles created by the two-phase nature of vapor processes, there are significant benefits that will ensure their continued use. To employ them effectively, the process approach must be adjusted to accommodate the realities of evaporation and condensation. Most important is the recognition that vapor processes are not single-phase. What may look like a gas should be recognized as potentially having some suspended or condensed liquid present. Vapor processes must accommodate the presence of two phases to be effective. Awareness of the properties of two-phase systems and the antimicrobial properties of H2O2 can lead to the establishment of reliable vapor processes.
Liquid Phase Kill is Extremely Rapid
There have been a variety of claims made regarding rapid kill rates in the vapor processes, presumably as delivered in the gas phase.11,12,13 However, the inability to determine accurate D-values for H2O2 processes cannot be resolved and raises questions regarding the accuracy of those claims. It is, however, entirely possible to determine reliable D-values for H2O2 /H2O liquid solutions. More recently, Block and others have reported D-values for liquid H2O2 processes with extremely short kill times.3,14,15,16,33 Considering these well-defined D-values for liquid systems, it suggests that gas phase kill rates must be slower. Otherwise, the presence of two phases would deliver extremely rapid kill as well. Based on this, condensation of some portion of the H2O2 in the gas phase to the liquid state should be recognized as desirable to increase process lethality.
Condensed Vapors Have High H2O2 Concentration
Condensation of the gas phase components as temperature drops within a system will result in a liquid phase that is higher in H2O2 concentration than it is in the gas phase. The boiling point of H2O2 is estimated to be 150.2°C, and its vapor pressure is substantially lower than that of H2O at ambient conditions.4,10,17 Thus, any condensate will have a higher concentration of H2O2 than the gas phase in equilibrium with it. Variations in local temperature will result in concentration differences in each phase across the system.
The Presence of Condensation is Difficult to Detect
Condensation of steam to liquid water results in a significant volume change, which is estimated to be approximately 800-fold. That means that ~800 mL of steam (water in the gas phase) condenses to 1 mL of liquid water. The change in volume for condensed H2O2 is likely to be of a similar magnitude, meaning that any condensed liquid H2O2 would be difficult to detect.
Tyvek® Packaging for Vapor Phase BI’s is Not Ideal
Many biological indicators use inoculated substrates (paper, fiberglass,s, and stainless steel are common) wrapped in glassine or Tyvek®.11,18,19
Paper is incompatible with H2O2 because it is chemically attacked, which precludes the use of glassine, a paper product.12 Tyvek® is the primary alternative, but its hydrophobic nature prevents the penetration of liquid H2O and presumably liquid H2O2 as well.21,22 This means that liquid H2O2 in the system may not be able to reach spores on the substrate. This may lead to increased survivability of the spores as H2O2 penetration through the Tyvek® envelope may only be possible in the gas phase.
Temperature Plays a Critical Role
The variation in vapor pressure of H2O2 and H2O is a strong function of the temperature. This is used to advantage in vapor processes, allowing these room temperature liquids to be introduced as a gas when heated above their boiling point. The flash vaporization is possible because the dehumidified hot air supply in these systems can accommodate larger amounts of both H2O2 and H2O in the gas phase than is possible at room temperature.12 When introduced into a large system at ambient temperature, the equilibrium vapor pressure of H2O2 and H2O will be lower, and condensation can occur. However, condensate can be nearly undetectable as the system volume may be sufficient to keep most of the H2O2 and H2O in the gas phase or suspended in it. Increasing the amounts of H2O2 and H2O introduced can result in more detectable condensation. The effect of temperature is such that the amount of condensation will vary with the local temperature gradients across the system. The greater moisture-carrying capacity of hot air, due to higher dew points, means that condensation is less likely to occur in the hottest locations; thus, condensation may not occur at all at the point of vapor entry and other ‘hot spots’ (e.g., running motors, heated jackets, etc.). The limited heat capacity of air (even when containing gas phase H2O2 and H2O) is such that temperatures inside the target chamber will remain close to ambient except near the heated vapor entry and other equipment-related variant locations.
Uniform Conditions Can Be Difficult to Achieve
As noted above about D-value determination, uniform conditions are preferable in sterilization processes to ensure sufficient lethality is delivered to all parts of the target load or environment. Steam accomplishes this easily because as it condenses (and heats), additional steam is drawn to that location due to the local drop in pressure as its phase changes from gas to liquid. Dry heat is inherently less uniform because of air’s poor heat capacity. Pure gas and liquid systems rely on thermodynamic principles (e.g., entropy) to deliver uniformity. and both systems can be further enhanced by mechanical agitation.
Vapor processes are frequently utilized in applications where turbulent air flow is considered undesirable. Unfortunately, aseptic rooms and, to an even greater extent, smaller enclosures (e.g., isolators) utilize unidirectional air in their vapor processes.23,24,25 The use of unidirectional air is antithetical to the requirements for an effective vapor process. Relying on a unidirectional air system to produce a well-mixed and uniform set of conditions is nearly impossible in a two-phase system. There will be unavoidable variations in phase, concentration, RH, temperature, and, therefore, variation in lethality across the environment. An ideal vapor system would include extensive mixing to ensure conditions are as uniform as possible.
Concentration Measurement Has Limited Utility
The two-phase reality of vapor processes limits the utility of concentration measurement because this practice can only measure the H2O2 present in the gas phase, ignoring any condensed liquid H2O2 suspended in the gas phase or condensed on surfaces.26 In addition, some instruments do not provide single-point measurements, further limiting their usefulness. In any case, the absence of definitive D-value information on H2O2 processes reduces the ability to use concentration measurement as an accurate predictor of lethality.
Biological Indicators are Well Controlled Systems
The preparation of reliable biological indicators requires considerable expertise and relies upon tightly controlled processes.20 Nevertheless, anomalous results with BI's appear with substantially greater frequency in vapor phase H2O2 processes than within all other sterilization methods combined. This suggests underlying difficulties with the vapor processes as opposed to frequent suggestions that ‘rogue’ BI's are the underlying cause. Comparable difficulties with subject to near identical manufacturing controls do not exist with other methods. It follows that ’rogue’ BI's do not exist so much as do insufficiently robust vapor H2O2 processes.36
BI’s Don’t Need 106 Populations
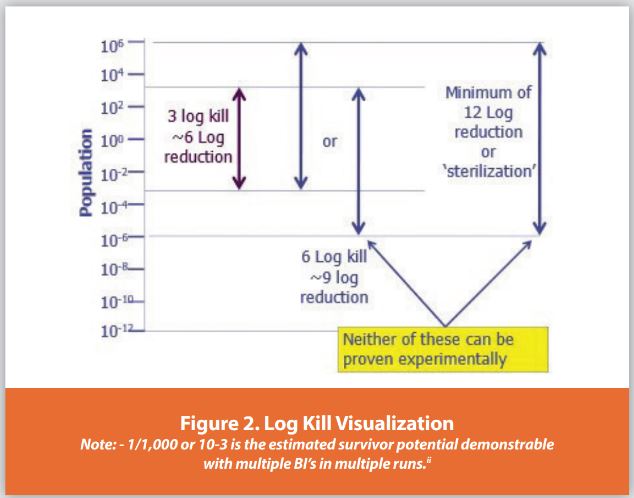
A frequent misunderstanding in sterilization of all types is the utilization of a minimum of 106 populations of resistant microorganisms for each bioindicator. The mistaken belief is that this population level is necessary because its destruction is required to demonstrate the ability to achieve and deliver a Probability of a Non-Sterile Unit of 1 in 106 (also written as PNSU < 10-6). This sterilization myth is false and has been dismissed numerous times, most recently in USP <1229> Sterilization.5,23,24 The PNSU is correctly calculated from the bioburden population and resistance. When the objective is room and isolator decontamination rather than sterilization, there are regulatory and other recommendations concerning ‘log-kill.’ This term has been commonly interpreted to mean the destruction of a biological indicator with the defined population (see Figure 2).27,28,29,30,31
Implementing Robust Vapor H2O2 Processes
The sterilization of materials is facilitated by reliable equipment and controls that deliver reproducible conditions across the system for each use. This is easier with single-phase systems and can be further improved by agitation. Single-phase sterilization processes approach uniformity across the target environment, which improves the ability to predict microbial destruction using knowledge of the D-value. Multiple-phase processes lack both the uniformity and D-value certainty associated with other sterilization processes and thus, have proven problematic to some practitioners.
The primary error with multi-phase processes is treating vapor systems (where condensation can occur) as gas systems (where condensation cannot occur). This misconception is widespread, and while there are recommendations to avoid condensation when using an H2O2 process, that is a thermodynamic impossibility. Were it possible, it would mean that the system could maintain a single phase and be treated as a true gas. That violates the laws of physical chemistry, which mandate that all systems seek equilibrium. Nevertheless, this expectation persists and has caused untold difficulties in the use of vapor processes.
Acceptance of the Physical Chemistry Reality
In the authors’ opinion, the first hurdle to overcome in using a vapor method for the delivery of hydrogen peroxide is the acceptance of liquid kill as the desired approach.3,15,16,17,33 With the introduction of hydrogen peroxide as a lethal agent, the mantra had consistently been to use it as if it were a gas, avoiding condensation at all times. When tolerating condensation at all, the consensus recommendation has been to limit condensation to the smallest amount possible.3,11,12 The authors believe that rather than fixating on avoiding or limiting condensation, it would be preferable to use an approach that delivers it effectively. The well-documented kill of microorganisms in liquid H2O2 points to the obvious. Rather than avoiding condensation, it needs to be recognized as a ‘best practice.’15,16,33 Before this notion is dismissed as costly, we believe that most existing delivery systems can be readily adapted to utilize liquid kill without physical change to achieve a more rapid and reliable outcome. For those whose objections are based upon a perception of a lengthy process dwell, our experience is that processes utilizing liquid kill are not significantly longer than those that intentionally avoid condensation.
Design for Uniformity and Reproducibility
Regardless of the process modality, there is general acceptance that establishing uniform conditions is desirable to ensure a reliable outcome. This cannot be overstated concerning vapor processes. Given the potential two-phase nature of H2O2 processes and the inherent temperature variations created by the means of introduction, the design should be adapted to enhance uniformity across the system. This can be achieved in multiple ways:
- Minimization of temperature variation – Insulation, inlet and exhaust ports, equipment stoppages, etc., should be managed to avoid potential ‘cold’ and ‘hot’ spots, which can alter the local conditions and affect lethality. This is particularly important with larger systems located across multiple environments where the conditions may differ significantly. A constant temperature is ideal, but largely unattainable given the heating and cooling associated with the introduction of a heated gas into the target environment. The background environment in which the system is located should be designed to maintain consistent temperature and humidity year-round to better support the reproducibility of conditions from cycle to cycle.
- Mixing of the internal volume – The use of unidirectional airflow for circulation within the system is rarely adequate in assuring an even distribution of H2O2 across systems.23,24 While unidirectional air is believed to be beneficial for the protection of surfaces during aseptic operation, its use is opposed to the goal of uniformity of conditions in a system to be decontaminated. Mixing is beneficial in single-phase sterilizing processes, so it is difficult to understand why there is any tolerance for inadequate mixing in a vapor system where a liquid is suspended in a gas. Insufficient internal mixing of the system means that the vapor process relies on the diffusion of H2O2 to penetrate a largely static boundary layer of air.
- Agent Introduction – The means for agent entry to the system should target even distribution across the full extent of the system. In large systems, multiple entry points are recommended. Introduction through HEPA filters is not mandatory and may be detrimental to the delivery of a uniform amount of H2O2 across the system. The location of air returns may also alter the internal concentration in the same manner.
Use an Empirical Approach
Establishing a reliable process for H2O2 requires using an approach long abandoned with other sterilization processing technologies. While other methods rely on the establishment of a direct and mathematical lineage between D-value determination, cycle development, and full-scale operation, vapor processes must be established and operated empirically. The use of empirical results does not mean that the process cannot be robust and reliable, rather, it should be developed to suit the specific circumstances of the system independent of assumptions regarding biological indicator resistance, the importance of physical measurements, and the maintenance of a single phase.
Conclusion
Vapor phase hydrogen peroxide (VPHP) processes have suffered an extensive number of unsatisfactory results. Much of this uncertainty is the result of the mistaken assumption that H2O2 vapor behaves as a gas or that it can be maintained in the gaseous state. Efforts to date have largely ignored the evidence that H2O2 liquid is more lethal than H2O2 gas and that favoring its presence rather than avoiding condensation may be the more optimal approach. More work needs to be done to provide conclusive evidence. Considering the lack of confidence expressed concerning VPHP as compared to thermal, radiation, or single-phase (liquid or gaseous) systems, that work is certainly warranted.34,35
CONFLICT OF INTEREST: The authors declare that they have no competing interests.
References
- www.lexico.com (accessed 10/11/2021)
- Physical Chemistry, 6th Edition, Levine, I., McGraw-Hill Education, New York, 2008
- Watling, D., “Is H2 O2 a Wet or Dry Process?, Presentation at PDA Isolator Technology Conference, 2002.
- Daubert, T.E., and Danner, R.P., Physical and Thermodynamic Properties of Pure Chemicals Data Compilation (Taylor and Francis, Washington, DC, 1989).
- USP 1229, Sterilization, USP36 1S 40(2), US Pharmacopeial Convention, Rockville, 2013.
- ISO 18472:2022 - Sterilization of Health Care Products—Biological and Chemical Indicators—Test Equipment. 2022.
- USP 1229.05, Sterilization: Biological Indicators for Sterilization, USP39 1S 41(2), US Pharmacopeial Convention, Rockville, 2016.
- USP, 1229.11. Sterilization: Vapor Phase Sterilization, USP38 1S 40(2), US Pharmacopeial Convention, Rockville, 2015.
- PDA, TR #51 – Biological Indicators for Gas and Vapor Phase Decontamination Processes: Specification, Manufacture, Control and Use, PDA Rockville, MD, 2010.
- Perry’s Chemical Engineers’ Handbook, 6th Edition, Ed. By R.H. Perry and D. Green, McGraw-Hill. New York, 1985.
- Grigonis, G., et al.l, “Chemical and Biological Aspects of Hydrogen Peroxide Vapor,” presentation at ISPE Barrier, Isolation Technology Conference, 2000.
- AMSCO, Cycle Development Guide, 129363-327, 1991.
- S.S. Block, “Peroxygen Compounds,” in Disinfection, Sterilization and Preservation, Lippincott Williams and Wilkins, Philadelphia, PA, 4th ed., pp. 167–181. 1991.
- S.S. Block, “Peroxygen Compounds,” in Disinfection, Sterilization and Preservation, Lippincott Williams and Wilkins, Philadelphia, PA, 5th ed., pp. 185–204. 2001.
- Ahlgren, M. and Bjorkland, Z., “Robustness of a Biological Indicator Resistance Test Rig—a Study of Different Parameters, Methodologies, and Their Impact on the Measured D-value of the Biological Indicator,” Lund University, LTH School of Engineering, 2005.
- Toledo, R.T., Escher, F.E., & Ayers, J.C., “Sporicidal Properties of Hydrogen Peroxide Against Food Spoilage Organisms,” Applied Microbiology, Vol. 26, No.4, p. 592-597, Oct. 1973.
- Coles, T., “Vapour Phase Hydrogen Peroxide Bio-Decontamination: How the Process Operates to Achieve Rapid Log 6 Reduction of Biological Indicators, presentation at ISPE Isolation Conference, February 2018.
- McCauley, Ket al. al, Biological Indicators for Sterilization, in Handbook of Validation in Pharmaceutical Processes, 4th Edition, ed. by Agalloco, J., DeSantis, P, Grilli, A., and Pavell, A., CRC Press, Boca Raton, 2021.
- Dupont, The Truth About Vapor Permeability in High Humidity Environments, Form No. 43-D100849-enNA-0320 CDP, 2020.
- Nieskes, R. ,”Are Tyvek®-Packaged Biological Indicators Appropriate for Vaporized Hydrogen Peroxide Decontamination?,” https://insidetheisolator.wordpress.com/2020/08/10/are-tyvek-packaged-biological-indicators-appropriate-for-vaporized-hydrogen-peroxide-decontamination/, accessed 10/14/21.
- Agalloco, J., “Real World H2 O2 Decontamination”, Pharmaceutical Technology, Volume 44, No. 1, pp. 53-57, 2020.
- Agalloco, J., “Paradise Lost: Misdirection in the Implementation of Isolation Technol,”y,” Pharmaceutical Manufacturing, Volume 15, No. 4, p. 34, 2016. Continued online at Pharmmanufacturing.com. Reprinted in Aseptic Processing Trends eBook, pp 9-17, July 2017.
- Meyer, D. “Design and Engineering of Isolators” in Advanced Aseptic Processing Technology edited by Agalloco, J. & Akers. J., InformaUSA, New York, 2010.
- Welter, V., “Points to Consider: Filling Isolators.” in Advanced Aseptic Processing Technology edited by Agalloco, J. & Akers. J., InformaUSA, New York, 2010.
- Nieskes, R. ”Are Tyvek Packaged Biological Indicators Appropriate for Vaporized Hydrogen Peroxide Decontamination.” https://insidetheisolator.wordpress.com/2020/08/10/are[1]tyvek-packaged-biological-indicators-appropriate-for-vaporized-hydrogen-peroxide[1]decontamination/, accessed 10/14/21.
- Agalloco, J., “Kill the Bioburden, Not the Biological Indicator,” BioPharm International, Volume 30, No. 4, pp. 50-52, April 2017.
- PDA, TR 34: Design and Validation of Isolator Systems for the Manufacturing and Testing of Health Care Products, Bethesda, MD, 2001.
- FDA, Draft Guidance for Industry: Sterile Drug Products Produced by Aseptic Processing, September Rockville, MD, 2002).
- Pharmaceutical Inspection Co-Operation Scheme, Recommendation on Isolators Used for Aseptic Processing and Sterility Testing, PI-014-2, July 2004.\
- USP, “Sterility Testing—Validation of Isolator Systems” USP 30, US Pharmacopeial Convention, Rockville, MD, 2008.
- Shibuya, Hydrogen Peroxide Vapor Decontamination System, client presentation materials, 2004.
- Amira, https://www.amirasrl.com/wp-content/uploads/2018/06/Brochure-Bioreset-Family-eng.pdf, accessed 6//7/2023.
- Comercer, https://www.comecer.com/decontamination-with-vphp-in-isolators-ideas-and-reflections-on-optimizing-cycle-times/ accessed 6/7/2023.
- MHRA, https://mhrainspectorate.blog.gov.uk/2018/04/20/vhp-vapour-hydrogen-peroxide-fragility/, 2018.
- Agalloco, J., https://www.linkedin.com/pulse/open-letter-response-mhra-blog-vapour-hydrogen-jim-agalloco/, 2018.
- Deinhard, P., Kaiser, U., & Kessler, H., “Test Method to Determine the Microbiological Resistance and Characterization of the Reaction Kinetics of Hydrogen Peroxide Sterilization Processes” Central Service Vol. 3, pp. 171-176, 2016.
- Kaiser, U., “Current Status of Standardization for Hydrogen Peroxide / Plasma Sterilization Processes” Zentralsterilzation, Vol. 29, No. 2, pp. 100-102, 2021.
- Agalloco, J., “idding the World of ‘Rogues’: Improving Vapor Phase H2 O2 Sterilization and Decontamination Processes”, PDA Journal of Pharmaceutical Science & Technology. Vol. xx, No. yyYypp z-zz, 2023.
Author Details
James P. Agalloco, BEChE, MSChE, MBA - Agalloco & Associates Inc
Phil DeSantis, BSChE, MSChE - DeSantis Consulting Associates LLC
Publication Details
This article appeared in American Pharmaceutical Review:
Vol. 28, No. 1
Jan/Feb 2025
Pages: 30-36
Subscribe to our e-newsletters.
Stay up to date with the latest news, articles, and events. Plus, get special
offers from American Pharmaceutical Review delivered to your inbox!
Sign up now!