Introduction
Gathering analytical data on impurities is important for early stage pharmaceutical development. In early development (phase I / II) the drug substance (DS) synthesis route, the solid state form and formulation are not final, however a HPLC method used for tracking and trending impurities is required. This information will give the process chemist / formulator understanding and enable improvement of the synthesis or formulation, setting specifications, releasing of batches, performing stability studies and determining storage conditions. While ICH guidance does not need to be rigorously followed in early stage development, it is beneficial to consider what will be required in the later stages of development [1].
Synthesis and physico chemical information, UV spectra and impurity / degradant information (although it is likely not all impurities / degradants are known) are valuable in helping to determine the objective and a starting point of an HPLC method [2]. Most DS in development, as well as their precursors and impurities, have a UV chromophore, and possess reasonable chemical stability in reverse phase chromatography. These mixtures can typically be examined with an iterative stepwise evaluation to determine suitable chromatography conditions for the separation of impurities. At the early stage of drug development, HPLC methods tend to be somewhat straightforward, flexible, relatively selective, and have large peak capacity, providing the chance to observe new impurities.
Many modern laboratories are equipped with efficient multi column vHPLC equipment with PDA / MS detectors and modeling software that collectively have the potential to provide significant benefits to method development and understanding. However, can these tools be used together as a method screening tool to both efficiently (~ seven days) and effectively (more than 80% of cases) develop impurity methods that will work for most DS? Here we describe a generic, concise design of experiments where representative samples are subjected to a predetermined set of chromatography conditions. Furthermore, physico chemical understanding, experienced chromatographers’ interpretation (making pertinent decisions at different stages), and peak prediction software collectively elevate the likelihood of developing a selective impurity method that meets the challenging needs of early development. Additionally with this systematic approach the legacy information may be re-used when a future change in the impurity profile occurs and facilitate faster method revisions.
Details on Approach
The use of vHPLC can significantly reduce analysis time lending itself to an increased scope of scouting experiments within a given timeframe [3]. The method can be simply transcribed into an equivalent HPLC method using a >2.5μm particle packed column [4,5]. Our strategy harnesses vHPLC to facilitate a two-step screening of representative samples with pre-defined parameters. Interpretation of the data at each step allows decisions to be made that limit experiments and streamlines the development process as shown in the schematic diagram in Figure 1.
The first screening step investigates the chromatography effects on the DS and impurities with changes in mobile phase pH. This screen at several pHs (incremental from 2 to 9) is particularly focused on changes in peak shape, on-column degradation and the relative retention time shifts of impurities. The second screening step, at the chosen pH only, evaluates the combination of organic solvent, column chemistry, temperature and gradient profile. Typically 4 columns are used that offer different types of selectivity [6,7] such as C18, polar embedded, phenyl and another type of C18 with a selectivity difference from the first C18. Organic phases tend to be methanol and acetonitrile and the gradient timeframe and temperatures are 10 & 20 minutes and 30 and 50 °C respectively. These are the default conditions, but they can be tailored to the analyte depending on the specific needs and information known. A review of the screening chromatography data output by a trained chromatographer can determine the particular column and conditions with the most promise, removing unnecessary work using the prediction software. The associated data can be simply imported into peak prediction software for simulation and the method optimized ‘in silico’ to give the desired selectivity and performance along with some assurances of method robustness. A vHPLC template-driven screening procedure further streamlines the work and enables a generic walk-up approach giving an ‘in depth’ time-efficient impurity method development, within seven business days.
Inevitably there will be cases where a fully satisfactory method is not obtained. Here a decision needs to be made on whether to risk using the ‘non ideal’ method or go back and repeat some aspects of the study. This may entail using a broader set of variables e.g. repeat step one (pH screen) with other stationary phases and/ or mobile phases, or repeat step two by screening with other stationary phases / mobile phases.
This approach to method development is not comprehensive and is by no means meant to be Quality by Design (QbD) or for NDA stage development. However, the strategy as shown in Figure 2 does provide methods that are appropriate for the early stages of drug development. The associated data provides a foundation that will assist in further method development when impurity profiles change, as method robustness is evaluated, and when orthogonal conditions are needed to assist potential investigations.
Why pH Screen First?
A significant number of drug substances and their precursors and impurities have pKas in the range of solvent buffers typically used in chromatography. A given change in mobile phase pH can significantly alter peak shapes (or not) but this can be hard to predict. Similarly, on-column degradation [8] and retention time shifts may be equally difficult to predict. Furthermore, if a pH screen is embedded with other variables in comprehensive screening studies; important information may be lost in the convoluted chromatography data. Selectivity is important and may be evaluated by changing several other variables [2]. These include varying; organic solvent by using different levels of acetonitrile (polar with π interactions) versus methanol (polar with H-bonding interactions); column chemistry where different stationary phases effect [5,6] the partition coefficient and silanol interactions; and gradient profile and temperature that can change ionization and partition coefficients. These variables should be evaluated together in a subsequent step to pH by use of a matrix study.
By completing the pH screening in the first step and looking at incremental changes, we recommend pH 2, 3, 5, 7 & 9, a clearer picture of performance vs pH can be determined. It is also recommended to perform the study using a single stationary phase (typically C18 with acetonitrile). Of course, when deciding on the pH, the chromatographer will have to balance the competing risk / reward factors for all peaks; this becomes easier when more is known about the samples and the relative importance of each peak. From the incremental pH assessment, a valuable robustness assessment may be performed by reviewing changes at the two pH profiles that bracket the pH of interest. Following the data review, a particular pH is chosen and will be used in the step two of the method development. We have found significant benefits in determining the pH first because it allows for a more expeditious and focused screening study. The only drawback to this approach is using a single stationary phase and the potential loss in selectivity; however one can always revisit the step with alternate stationary phases if warranted. Following are two examples to illustrate the pH screening step.
As shown in Figure 3 the peak shape of the main peak significantly changes across the pH range of 2 - 9. At pH 2 and 3 the peak is tailing significantly, suggesting either column overloading, or a mixed mode mechanism of retention, possibly silanol interactions (it was determined to be column overloading in this case). At pH 5 there is still tailing but the ionization has changed as it is more retained. At pH 7 it has an improved peak shape and a longer retention time suggesting it is being retained using a single mode of interaction. However at pH 9 the peak is now significantly fronting and the fact that it is over a significant time period suggests on column degradation. Clearly pH 7 is the choice for chromatography; however it will probably be worth investing some time to understand why the peak is being affected so much.
As shown in Figure 4, relative retention time of two impurities noticeably change across the range of pH 2 - 7. At pH 2 and 3 these two well resolved impurity peaks elute well before the main peak. At pH 4, the two impurities increase their retention times and are still well enough resolved, however a third peak moves from under the main peak to an earlier retention time. At pH 7, the two peaks are slightly less resolved and the third peak begins to elute earlier. All other peaks, including the main peak, do not change retention time whereas the impurity peaks being discussed must be changing their ionization as the pH changes. pH 5 provides the most desirable selectivity and is between two other pH conditions where the chromatography is stable, suggesting pH robustness. It is interesting to note that although the main peak probably does not have a pKa some of its impurities do.
When is a Method Good Enough?
Method objectives can often be oversimplified or left to evolve over time. It is important to recognize that certain criteria /standards must be agreed to ahead of time to uphold the quality of analytical methods or to prevent ever increasing development (method creep).
For a project in early development it is conceivable that a specific method may go through several iterations prior to an NDA filing, therefore some compromises and risks are undoubtedly justifiable. Every analyte / chromatographer / project may have its own specific criteria / justification, and trade offs will inevitably be made. However in most cases the following are reliable criteria for pH I/II methods. These should be considered recommendations and not hard and fast rules:
• Main peak tailing factor between 0.8 and 1.5.
• Main peak is resolved from impurities with a resolution factor of > 1.5.
• Key impurities are resolved from each other with a resolution factor of > 1.5.
• Less frequent or well controlled low level impurities resolved from impurities by > 1.2.
• Peak purity of main peak should be confirmed using PDA detector (LC-MS is also recommended).
• The limit of quantitation (LOQ) should be <0.05% at the given wavelength.
• The impurities should have similar chomophores to the main peak or the RRF determined to enable accurate assessment of quantities and mass balance calculations.
• Use as low a wavelength as possible however if the method requires a wavelength greater than 280 nm then dual wavelengths should be considered.
• Peak capacity of the chromatography should preferably greater than double the number peaks being analyzed. vHPLC run time should be less than 15 minutes.
Furthermore, the diluent should be selected based on solubility, early eluting peak shapes, and reproducibility. A review of the methods simplicity and ease of use is advised. Also, method robustness should be evaluated using the peak prediction software in terms of gradient / mobile phase / temperature. The method should be capable of routinely passing the USP system suitability criteria [9] and passing the required validation criteria from internal guidelines / SOPs.
Experimental
Instrumentation: The method development was performed on a 4 column vHPLC system equipped with a photodiode-array detector and a solvent selector valve.
Peak prediction software: Chromatograms were processed and saved as .AIA files and exported to the peak prediction software.
Sample preparation: Representative DS and impurities / degradants from different lots or spiked samples were prepared at ≥0.2 mg/mL in up to 3 samples depending on availability and number. It is recommended to use <50% organic (depending on solubility) in the diluent to reduce the risk of early peak shape problems and retention time drifts.
Mobile phases: Mobile phase A (five buffers from pH 2 to pH 9 were used) : 0.1% TFA (pH 2); 0.1% formic acid (pH 3); 20 mM ammonium acetate adjusted to pH 5 with acetic acid (pH 5); 20 mM ammonium acetate (pH 7) and 20 mM ammonium bicarbonate adjusted to pH 9 with ammonium hydroxide (pH 9). The solvent selector valve supports up to six different solvents and can be controlled remotely by HPLC control system Mobile phase B (organic modifier): B1) acetonitrile and B2) acetonitrile / methanol (50/50) mixture
HPLC columns: Four columns were assayed: all having 100mm x 2.1mm dimensions. C1: vHPLC C18, 1.7μm C2: vHPLC Polar embedded RP18, 1.7μm C3: fused core C18, 2.7 μm C4: Phenyl-Hexyl, 1.8μm
Analysis conditions / variables: Step 1 pH screen: All samples (1 μL injection) were analyzed with mobile phase A (pH 2-9) with mobile phase B1, and Column C1 (C18), injected at all pH conditions; 0.4 ml/min flow rate, 20 min gradient from 5-90%B1, 30 °C.
Step 2 column and chromatography condition screen: All samples (1 μL injection) were analyzed at 0.4 ml/min using mobile phase A (pH of choice from Step 1) with a matrix study: B1 and B2 organic mobile phase gradient from 5-90%, C1 -C4 columns, 10 and 20 minute runtime, 30 and 50 °C.
The solvent selector valve supports up to six different solvents and can be controlled remotely by vHPLC control system. The vHPLC run sequence is templated for both steps with total runtime of ~12hrs for Step 1 and ~36 hrs for Step 2 depending on number of samples.
Results and Discussion
The structures of compounds used for method development are proprietary. However for this discussion, it is sufficient to note that compound X has a strong UV chromophore that is also present in the related substances structures. The DS does not contain any ionizable groups. Step 1 pH screening (from 2 - 9), shown in Figure 5, shows that the main peak is unchanged in retention time and peak shape. All of the later eluting peaks do not change retention time, suggesting they too do not contain any ionizable groups. The early eluting impurity peak retains later as the pH increases until at pH 5 where it elutes at a consistent retention time through to pH 9. Another early eluting peak appears at pH 5 and changes retention time at pH 7, however it remains unchanged at pH 9. This peak was found to be co-eluting under the main peak at pH 2 and 3 by LC-MS. From review of the chromatography, either pH 7 or 9 were appropriate for the next step, but pH 7 was chosen only because it is known how the peaks can change between 7 and 9 but not beyond pH 9.
Review of the chromatography obtained from the Step 2 column and condition screening showed that the resolution of a pair of impurities eluting after the main peak was critical for method performance. The optimal resolution of this pair was obtained with the phenyl hexyl column based on both peak movement and selectivity. The addition of methanol and change in temperature had significant effects on the peaks’ relative retention times. The selected processed chromatogram data was imported into the peak prediction software. Using the criteria outlined above in the method objective and manipulation of chromatograms ‘in silico’ gave an optimized method with a predicted resolution of 1.9. The method used a linear gradient with 20 mM ammonium acetate and methanol / acetonitrile over a 10 minute time period with the column temperature at 40 °C. This method had advantages of being simple (an added attraction for technical transfer in the future) and robust, based on review of the contour plot changes in the peak prediction software when changing the method conditions. Using an authentic sample the predicted chromatography was confirmed with a virtually identical chromatogram to that predicted and the critical pair of impurity peak resolution was 2.0 (see Figure 5).
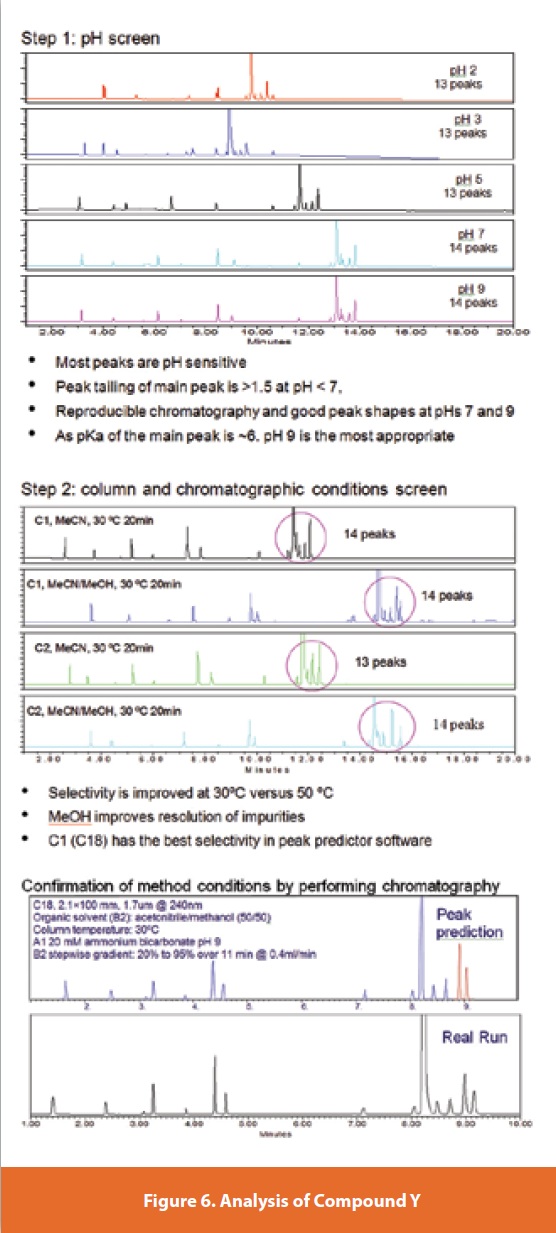
With the second method development example compound Y, the DS has an ionizable functional group and a strong chromophore. The related substances also have similar UV spectra. From the Step 1 pH screen, pH 2-7 (shown in Figure 6), all the peaks’ retention times move and the relative retention times are changed for a significant number of the 14 impurities. The peak shapes at pH 2 and 3 were generally broad but were significantly improved at pH 7 and above. The relative retention times remained stable between pH 7 and 9, and peaks were reasonably well resolved from each other. The DS pKa is ~6 and based on this pH 9 was chosen over pH 7 for Step 2 of the method development. The Step 2 column and chromatography condition screen highlighted that temperature had a significant effect on selectivity of peaks eluting close to the main peak. Furthermore, the addition of methanol in mobile phase B enhanced the resolution of some closely eluting impurity peaks. From evaluation using the peak prediction software, it was found that the C18 column generally gave the best selectivity. From the ‘in silico’ development the most appropriate conditions were a step gradient over a range of 20-95% of mobile phase B (acetonitrile/methanol 50/50). As shown in Figure 6 the actual run gave a virtually identical chromatogram with well resolved peaks and a significant amount of peak capacity for any other related structures that may be encountered in the future.
The third method development example, compound Z, the DS had a pKa ~5 and a moderate chromophore with related substances having similar UV spectra. From the Step 1, pH 2-7 (shown in Figure 7), all the peaks’ retention times move from pH 2-5. The main peak shape has a slight tail at all pHs. The relative retention times remain stable between pH 7 and 9, except for one impurity peak and all peaks were reasonably well resolved from each other. Based on the pKa and the reproducibility of the peaks, pH 7 was selected. The step 2 column and chromatography condition screen highlighted that temperature had an effect on selectivity. All peaks were separated with the four columns however the selectivity seemed to be better with the C18 column. From the ‘in silico’ development the most appropriate conditions were at 45°C with a gradient over a range of 5-90% of mobile phase B of acetonitrile. As shown in the figure the actual run gave a similar chromatogram.
From the examples, it can be seen that the method development is intuitive and simple, with each Step building on information found, giving a heightened chance of success. In all cases the method criteria were satisfied including peak purity that was obtained from PDA data collected using the final chromatography conditions. From experience with these compounds and others the success rate is ~80%. Even with the 20%, where the method was not satisfactory, from understanding the method shortfalls and using the information obtained from Step 1 to design a repeat experiment of Step 2, using different column selectivity, in most cases a suitable method was found. The most common difficulties arise when balancing selectivity over robustness (obtained from peak predictor), deciding which peaks take precedence over other peaks when trading off selectivity and deciding whether to stop or continue with method development - again, the method objective criteria can be very helpful with this.
The timeframe of development with this approach is usually a split of 50% time reviewing data and making decisions and 50% collecting data. Method development generally takes seven days, depending on the number of samples and complexity, and is considered to be within the timeframe usually budgeted for early method development. Other added benefits come from training being straight forward, method comparisons are simpler, development decisions are aligned across the lab (maintaining standards) and trouble shooting easier, knowing that additional information is available from the development data package and a simple ’in silico’ tweak may understand / solve the problem.
Conclusion
We have demonstrated a systematic approach to vHPLC method development and highlighted the importance of first completing pH screening for early stage method development. This uses readily available equipment, coupled with a simple strategy and clear decision criteria to develop suitable methods within a seven day period. As routine / common conditions are used in the study, the conditions are likely to be both robust and easy to tech transfer.
This approach has been found to be simple and easy to train other people on. The simplicity also lends itself to tracking and trending method development successes and failure for further optimization of this approach based on organization demands. This standard method development package is also available as a resource for further method development if a new impurity is found. Furthermore, the use of the predictive software provides a cursory review of method robustness that is often lacking with early development methods. It is feasible that information obtained from this method will dovetail into later stage QbD by serving as a basis for a risk assessment.
Acknowledgments
We are grateful to Brent Kleintop, David Lloyd, Joan Ruan, Ruben Lozano, Steve Klohr and John Grosso.
References
1. International Conference on Harmonization, (2003) ICH Q3A&B(R)
2. L. R. Snyder, J. Kirkland, J. Glajch, Practical HPLC Method Development, (1997) Wiley- Interscience, New York
3. B. L. Kleintop and Q. Wang, American Pharmaceutical Review, (2010) May-June, 62-67
4. U. D. Neue, D. McCabe, V. Ramesh, H. Pappa, J. DeMuth, Pharmacopeial Forum, (2009) Vol. 35 (6) 1622-1626
5. U.D. Neue. Journal of Chromatography A, (2005), 1079, 153-161
6. L. R. Snyder, A. Maule, A. Heebsh, R. Cuellar, S. Paulson, J. Carrano, L. Wrisley, C. C. Chan, N. Pearson, J. W. Dolan, J. J. Gilroy, Journal of Chromatography A (2004), 1057(1-2), 49-57
7. M. R. Euerby, P. Petersson, Journal of Chromatography A (2003), 994(1-2), 13-36
8. F. Bell, J. W. Dolan, LC-GC North America, (2006) 24, 1184-1190
9. US Pharmacopeia, (2009) USP32-NF27, General Chapter <621>
Author Biography
Peter Tattersall is a Senior Research Investigator in Analytical Research and Development at Bristol-Myers Squibb Company in New Jersey. He received his BSc. and Ph.D. from the University of Manchester, UK. He worked in Analytical Development at AstraZeneca, Wilmington prior to joining Bristol-Myers Squibb in 2003 where he currently supports both API and drug product development.
Li Li is a Research Investigator in Analytical Research and Development at Bristol-Myers Squibb Company in New Jersey. She received her BS. from Hubei University, China and Ph.D. from the State University of New York at Buffalo. She Joined Bristol- Myers Squibb Co. in 2008, where she currently supports both API and drug product development.
Qinggang Wang, Ph.D. is currently a Senior Research Investigator within Analytical R&D at Bristol-Myers Squibb, where he has worked for the past 7 years. Qinggang’s research interests involve utilizing different separation-based methods to improve characterization of drug substances and drug products.