Introduction
Drug polymorphism has been studied closely in pharmaceutical science because the API (pseudo) polymorphs can play a critical role in the drug absorption and bioavailability [1-3]. The creation of amorphous API during processing operations and/or conversion to amorphous API in the drug products could be problematic for drug development [4-5]. Thus, it is critical to monitor the presence of amorphous API content to ensure the intended stability and bioavailability of the formulated products.
For the study in this article, the amorphous API was found in the drug product. With no detectable level of amorphous in the initial API crystalline form or its initial blend in the formulation, amorphous material was generated during the wet granulation process. The Design of Experiment (DOE) study concluded that the growth of amorphous material was dependent on the holding time in the wet granulation as well as its exposure to moisture. In this case, effective monitoring of amorphous content was carried out during the product manufacturing.
Many techniques, such as powder X-ray diffraction (PXRD) [6- 7], thermal analysis [8-9], Solid State Nuclear Magnetic Resonance spectroscopy (SS-NMR) [10] and other spectroscopic methods [11- 12], are used to characterize and quantitate amorphous material found in pharmaceutical products. For the quantitation of low percentages of amorphous material in pharmaceutical products of low drug load, Raman spectroscopy, combined with chemometrics, has been increasingly used as a technique that is highly sensitive to the small quantities of amorphous API [13-14].
The drug product investigated has a low drug loading of 5% (w/w) and the amorphous content is approximately 25% (w/w) of the total API weight, thus requiring a sensitive technique for quantitation of the amorphous material. The spectroscopic techniques including FT-Raman, PXRD and SS-NMR were explored to characterize and quantitate the amorphous API in the drug product. PXRD is only sensitive to crystalline materials, and was not suited for quantifying amorphous levels in the drug product of very low API load. While SS-NMR is capable of distinguishing between the crystalline and non-crystalline forms of the API, the technique requires numerous scans and long relaxation times resulting in a multi-day data acquisition time for each sample. Therefore, neither PXRD nor SS NMR was a practical technique for developing a method for the quantitation of the amorphous API in this drug product. Fourier Transform (FT) Raman, combined with Partial Least Squares (PLS) regression, offers distinct advantages over the other techniques for the rapid measurement of low level amorphous content in the drug product. Equipped with a near-infrared laser, FT-Raman measurements have reduced the risk of the strong fluorescence interference from degradation products. In addition, instrument specific advantages, such as laser defocusing and a sample spinning apparatus for better sampling techniques enables the development of an efficient and effective FT-Raman method for the rapid quantitation of low level of amorphous in the formulated tablets.
FT-Raman measurements were utilized to quantitate the amorphous content that is typically within a range of 37-55% (w/w with respect to API substance in the product) in the processed tablets of a drug load of approximately 5% (w/w). The method presented in this study was developed in the research laboratory (primary method). The technology was transferred and the method was optimized at the manufacturing site (secondary method).
For the technology transfer between the two Raman spectrometers (from different vendors), the model calibration/validation samples had to be prepared separately per the requirements of different sites. In addition, the optical configuration of the FT-Raman spectrometers differed. The prediction accuracy of amorphous content with respect to API, in a drug product of low drug load, was less than 2.00% at both sites. The procedure and results of the method development, validation, and technology transfer are discussed in the present work.
Experimental
The primary method was created on an FT-Raman spectrometer equipped with a LN-cooled Germanium (Ge) detector and a 1.06 μm laser. A laser power of 225 mW was defocused, providing an illuminated spot of ~ 1mm2. The secondary method was developed on an FT-Raman spectrometer equipped with an InGaAs detector and a 1.06 μm laser. A laser power of 600 mW was defocused, providing a spot of ~ 1mm2.
Samples were gently ground and stored in 5 mm NMR tubes, which were mounted on a sample spinner to reduce sampling inhomogeneity and to avoid heating of the sample. Standards for model calibration were made by mixing the known amount of different forms of API and placebo, and the weight percent of the amorphous API is used as reference value.
In both methods, 128 scans were collected for each spectrum. Spectra were acquired over the spectral range of 3600 – 200 cm-1, with a spectral resolution of 4 cm-1. Five spectra were collected for each sample with re-packing the material in the NMR tubes between measurements, and then averaged prior to data analysis.
Results and Discussions
Spectral Interpretation
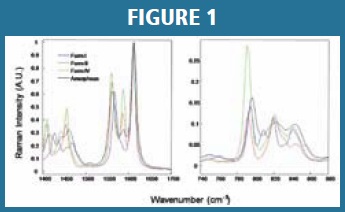
Several solid state polymorphs exist for the studied API with the desired Form I generated during API crystallization. In addition to Form I, two minor undesired crystalline polymorphs, Form II and IV, as well as the amorphous form were found to generate and grow in API or drug processes. The Raman spectra of API crystalline Form I, II, IV and amorphous form are readily distinguishable in two spectral windows: 1400-1700 cm-1 and 740-880 cm-1. Each Raman spectrum was intensity normalized by the strongest Raman peak at 1611 cm-1 (Figure 1, left panel). A weak Raman peak at 1588 cm-1 was found for the amorphous API that is not observable for Form I of the API. Additionally, a red shift of the 1560 cm-1 Raman band in Form I was observed with increased amorphous content. Figure 1, right panel, demonstrates that the Raman polarizability is relatively weak in the 740-880 cm-1 spectral window. The unique Raman spectral fingerprint of each component made it possible to distinguish the amorphous API from other API polymorphs. The spectral similarities between amorphous API and API Forms II and IV imposed challenges on method development; however, the amounts of Forms II and IV in the product are not significant - typically less than 5% (w/w) combined of the total API, and the interference was studied.
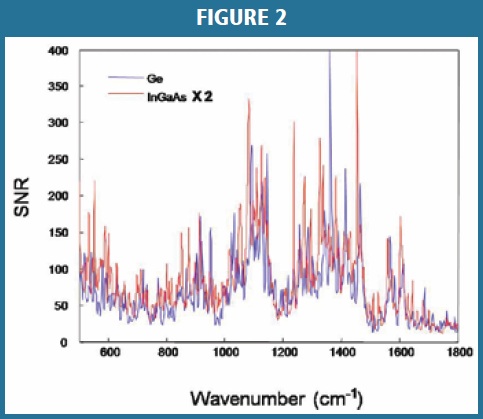
To ensure a smooth technology transfer between the different spectrometers, instrument sensitivity was characterized from the Signal to Noise Ratio (SNR) for both Raman systems (Figure 2). Ten spectra were collected on each instrument using the same sample and an identical configuration for each spectrometer. Subsequently, the SNR was compared at each wavelength in the spectral range of 500 – 1800 cm-1. The SNR of the Ge detector (primary method) was found to be almost twice that of the InGaAs detector (secondary method); thus, the signal to noise ratio for the InGaAs detector was multiplied by a factor of 2 for comparison. In order to achieve equivalent spectral quality for the secondary spectrometer (InGaAs), the laser power was increased allowing for similar instrument sensitivity to the primary method.
PLS Model Calibration
While similar strategies were implemented for both primary and secondary methods, the secondary (transferred) method is discussed herein. For the model development in the secondary method, a total of 60 Raman spectra were used including 47 spectra for calibration and 13 spectra for validation. Within the calibration set, 26 spectra were standards prepared by various analysts with API crystalline Form I, amorphous API and drug product excipient components prepared with the identical wet granulation method used for the drug product production. The other 21 calibration spectra were acquired from DOE robustness samples incorporating the variations in the amount of major excipients (lactose and microcrystalline cellulose or MCC), interference from other minor API crystalline Forms II and IV, amorphous batch variations, and sample tubes from various vendors.
Spectra of drug samples were preprocessed by calculating the first derivative of each spectrum and then mean-centering all data. Two spectral regions, 1626 - 1520 cm-1 and 822 – 787 cm-1, were chosen for the primary method, while one spectral range, 1626 - 1520 cm-1, was optimized for the secondary method (based on the minimum error of prediction). For the primary method, Multiple Scattering Correction (MSC) was found to be optimal, however due to variations in detector efficiency (LN-cooled Ge versus InGaAs), first derivative data pretreatment was applied to the spectra in the secondary method. Cross validation was performed with the leaveone- out method.
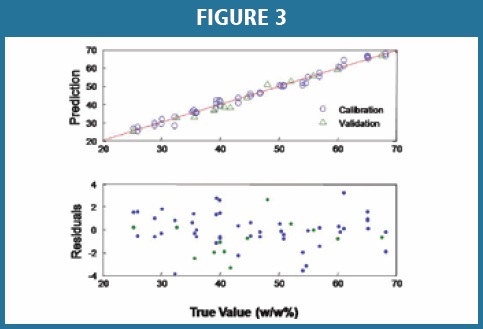
For the secondary method, the PLS prediction of amorphous material content in the drug product for both calibration and validation results is displayed in Figure 3. The residuals plot for the predictions is also shown in Figure 3, bottom. For the secondary method, a Root Mean Squared Error of Prediction (RMSEP) of approximately 1.65% (w/w) represents the overall difference between the model predicted values and the true values of amorphous API in the standards. The PLS model was optimized with three latent variables for the drug product. The coefficient of determination (R2) for the linear prediction is 0.98 in the concentration range from 25.00 – 68.00% (w/w) of amorphous API content.
Model Robustness Strategies
Excipient Variations: Multivariate data analyses such as PLS are sensitive to variations of the major constituents [15], particularly for formulations with a low API load due to the fact the drug product Raman spectra are the weighted sum of all contributing components (API and excipients). The two major ingredients in this drug product are the binding agent lactose and adsorbent MCC. Even though strong contributions from excipients were not expected to be in the chosen spectral window(s), the DOE standards included variations of up to ~ 10% of both excipients, and was integrated into the PLS model to expand the model space.
Interference of Minor Crystalline Forms: Raman spectral features from crystalline polymorphs Form II and Form IV have been observed in the spectral window(s) in both the primary and secondary models (Figure 1) and are similar to features observed in the amorphous API. Although the presence of these polymorphs is found to be limited in the drug product, potential spectral interference of the components during quantitation cannot be underestimated. DOE samples, designed with allowable concentrations of crystalline Forms II and IV as dictated in the drug product specifications, were included to reduce any possible interference due to an inherently similar chemical structure and spectral features.
Glassware Influence: Raman spectra are susceptible to scattering differences and impurity content in the sampling glassware; this may cause absorbance of light and induce a fluorescence background. Sample tubes from two manufactures were incorporated into the model to accommodate variance in the method development. There were no significant differences in the spectra collected with sample tubes from either vendor.
Degradation Product Interference: Degradation products of API in the drug product may exhibit similar Raman features in the spectral region of interest as the major degradation products have related chemical structures to the API. Four major degradation products were identified for the API. One of the degradation products was found to present very unique spectral features, and another degradation product was identified as unstable and present at negligible levels; thus, these degradation products were not considered to be relevant in the method development. An overlapping feature of the API Form I and amorphous material was observed with the other two degradants. The potential interference with the amorphous measurement using the FT-Raman model was estimated for two degradation products at the maximum allowable level of 0.5 and 1.5% (w/w) of the total. The maximum prediction deviation from true values of amorphous content was found to be 0.87% for the samples of amorphous concentration from 40.00 to 45.00% in API. There was no observable difference between the calculated values or residual pattern of the model prediction with and without the degradants in the numerous sample designs. Therefore, the model is relatively robust to this variation, and no DOE samples with degradation product were used for the model development.
Instrument Signal to Noise Ratio (SNR): The spectral noise, which contributes to the uncertainty in the model prediction, arises from the instrument instability and sample preparations. While the sample focusing is of less concern with the use of laser defocusing, the Raman spectra of the samples were acquired with different incident laser powers and with different total number of scans. The standard deviation of 0.50% from the model predictions with various SNRs were well within the prediction error. Thus, the effect of the predictable level of noise variation had negligible impact on the model. Rotation
Rate Dependence: It is not uncommon that noise may be introduced with FT technology due to the nature of the sampling technique such as spinning the sample in an NMR tube. Two samples were analyzed at three different sample rotation speeds: 25, 35 and 60 rotations per minute (rpm). The standard deviation of 1.22% was observed for the calculated amorphous content with different spinning rates. Therefore, there was no indication that rotation rate had effect on the prediction.
Sample Grinding Effect: Grinding was necessary for drug product sample preparation; however, it is well known that the solid state form of any polymorphic compound can be altered by grinding [16]. To assess prediction error introduced by inconsistent sample preparation, samples of the drug product from the same batch were ground with light, medium, and hard force. Each of the ground samples were then analyzed by FT-Raman spectroscopy and the percent amorphous content of each sample was calculated using the developed PLS model. The standard deviation of 1.21% indicated that all the grindings generated the prediction error within the uncertainty of the method. As a result, the difference in grinding did not have a significant effect on the model.
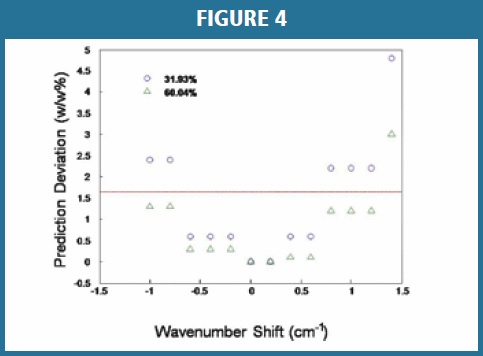
Wavelength Stability Influence: It is known that a multivariate data model may be very sensitive to the X-axis error [17] caused by temperature fluctuation of the laser or misaligned optics. The derivative-like intensity variation caused by a small wavelength shift could play a critical role in the model uncertainty and precision. Two samples of amorphous levels at 31.93% and 60.04% (w/w) were tested for the impact of wavelength shift. The manual bandshift of spectra was recorded in wave number (cm-1) with respect to the strongest peak at 1611 cm-1. Prediction deviations from the calculated values of original spectra were demonstrated for both samples in Figure 4. In this case, the criteria for the instrument system suitability test was configured to ensure wavelength accuracy based on the peak position of the polystyrene standard. To pass the wavelength accuracy test, the measured wavelength must be within 3σ of the known wavelength value in the default setting; this is equivalent to ± 1.6 cm-1 of the known peak position within the chosen spectral range. The data in Figure 4 reveals that the prediction deviation may exceed the RMSEP of 1.65% (dashed line) of the model when the wavelength shift exceeds 1.2 cm-1. This demonstrates that samples could be treated as ‘outliers’ simply due to a wavelength shift on the instrument, even though the instrument passes the system suitability test. This test revealed that extra caution must be exercised to ensure that the wavelength shift is within ± 1.2 cm-1 of the peak positions in the region of interest for daily use of the model. This is particularly critical to identify error sources when a predicted outlier occurs for the sample testing.
Amorphous Standards Variation: Typically amorphous solids exhibit only short-range order, the characterization of a purely amorphous reference, if possible, can be carried out in a reasonable level of detail [4]. However, there is still notable difference between the current techniques in their ability to quantify the percentage order and disorder in amorphous materials, the interpretation of spectroscopic data for the subtle batch to batch variations may be quite complex. Since the current prediction models for the primary and secondary methods were calibrated with different batches of amorphous API materials processed under slightly different conditions, an extensive DOE study with calibration samples from various batches of amorphous API was integrated into the final model for additional model robustness.
Method Validation
Method validation was conducted and analyzed for the model accuracy, in addition to the specificity and robustness, as discussed previously. The RMSEP of accuracy validation was found to be 0.97% for seven external drug product samples in the amorphous concentration range of interest, well below the RMSEP of 1.65% for the FT-Raman method. The correlation between the predicted values and the reference values is adequately described by a linear regression, since the quadratic coefficient is not significantly different from zero (p-value of 0.70).
Conclusion
An FT-Raman spectroscopic method, with an appropriately chosen chemometric model, has provided a robust and efficient tool to monitor the amorphous API content in a drug product with a low drug load of approximately 5% (w/w). An RMSEP of less than 2.00% was achieved for the amorphous API prediction over a range of 25.00 – 68.00% (w/w) for drug product.
References
1. G. Winter, “Polymorphs and Solvates of Molecular Solids in the Pharmaceutical Industry”. Editor(s): E. Boldyreva and V. Boldyrev. Molecular Solid State, 3 (1999) 241-270.
2. Y. Zhou, N. Crane, C. Cai and Y. T. Cain, “Model for Raman Spectroscopic Monitoring of Process-induced Pseudomorph Interconversion”, American Pharmaceutical Review, 12 (4), (2009) 56-63.
3. C. Saal, “Quantification of Polymorphic Forms by Raman Spectroscopy”, American Pharmaceutical Review, 9 (4) (2006) 76-81.
4. B. Hancock and G. Zografi, “Characteristics and Significance of the Amorphous State in Pharmaceutical Systems”, Journal of Pharmaceutical Sciences, 86(1) (1997) 1-12.
5. J. K. Guillory, “Generation of Polymorphs, Hydrates, Solvates and Amorphous Solids”, Drug and the Pharmaceutical Sciences, (Polymorphism in Phamarceutical Solids), 95 (1999) 183-226.
6. J. Faber, “Application of Powder Diffraction studies of Materials That Contain Crystalline and Amorphous Constituents”, American Pharmaceutical Review, 4 (2) (2001) 46 – 52.
7. A. Newman, D. Engers, S. Bates, I. Ivanisevic, R. C. Kelly and G. Zografi, “Characterization of Amorphous Active Pharmaceutical Ingredient (API): Polymer Mixtures Using X-ray Powder Diffraction”, Journal of Pharmaceutical Sciences, 97(11) (2008) 4840-4856.
8. M. Phipps and L.A. Mackin, “Application of Isothermal Microcalorimetry in Solid State Drug Development”, Pharmaceutical Science & Technology Today, 3(1) (2000) 9-17.
9. N. Fagegaltier, A. Lamure, C. Lacabanne, C. Caron, H. Mifsud and M. Bauer, “Thermal Analysis of Amorphous Phase in a Pharmaceutical Drug”, Journal of Thermal Analysis, 48(3) (1997) 459-464. H. Robin, “Applications of Solid-state NMR to Pharmaceutical
10. Polymorphism and related matters”, The Journal of Pharmacy and Pharmacology, 59 (2) (2007) 225-239.
11. A. Heinz, C. Strachan, K. Gordon and T. Rades, “Analysis of Solid-state Transformations of Pharmaceutical Compounds Using Vibrational Spectroscopy”, Journal of Pharmacy and Pharmacology, 61(8) (2009) 971-988.
12. B. Connolly, T. Patapoff, Y. J. Wang, J. Moore and T.J. Kamerzell, “Vibrational Spectroscopy and Chemometrics to Characterize and Quantitate Trehalose Crystallization”, Analytical Biochemistry, 399 (1) (2010) 48-57.
13. L. S. Taylor, “Raman Spectroscopy as a tool to Probe Solid State Form in Tablets”, American Pharmaceutical Review, 4(4) (2004) 60-67.
14. A. M. Tudor, S. J. Church, P. J. Hendra, M. C. Davies and C. D. Melia, “The Qualitative and Quantitative Analysis of Chlorpropamide Polymorphic Mixtures by Near-Infrared Fourier Transform Raman Spectroscopy”, Pharmaceutical Research, 10 (12) (1993) 1772-1776.
15. Y. Goggo, K. Degardin and P. Margot, “Identification of Pharmaceutical Tablets by Raman Spectroscopy and Chemometrics”, Talanta, 81 (2010) 988-995.
16. L. F. Petrovic, L. K. Gvozdenovic and S. E. Antonic, “The Effects of the Fine Grinding on the Physicochemical Properties and Thermal Behavior of Bentonite Clay”, J. Serb. Chem. Soc. 67(11) (2002) 753-760.
17. M. J. Pelletier, “Quantitative Analysis Using Raman Spectrometry”, Applied Spectroscopy, 57(1) (2003) 20A-39A.
Yong Zhou is currently a principal scientist in Pfizer Research Science and Technology (RS&T) in Groton, Connecticut. His areas of interest include optical spectroscopy and imaging along with molecular modeling, Process Analytical Technology (PAT) and Quality by Design (QbD). Prior to Pfizer (Wyeth), Dr. Zhou worked at Johnson & Johnson. He has authored more than a dozen publications in the areas. He has a Ph.D. in physical chemistry from Boston University.
Rebecca LoBello is currently working as a Senior Analytical Chemist in Analytical Sciences of Scientific and Laboratory Services, Pfizer in Pearl River, New York. She received her PhD in chemistry from the Pennsylvania State University in 2008, with Prof. Karl Mueller. After graduating, she joined the Spectroscopy and PAT group Global Quality Analytical Development, Wyeth Pharmaceuticals where she worked on analytical method development for new drug products. Her scientific interests include Solid State NMR and vibrational spectroscopy.
Chun Cai is a Principal Scientist III working in Pfizer’s Global Quality Operations. His areas of interest include data analysis and PAT method development and implementation. Prior to Pfizer (and Wyeth), he worked at Sanofi Aventis for over seven years. He earned his Ph.D. in analytical chemistry with focus on chemometrics from Ohio University.
Nicole Crane, Ph.D. is currently a Scientist at the Naval Medical Research Center in Silver Spring, MD where she is establishing the Regenerative Medicine Department’s Advanced Imaging Program. Her research focuses on development and utilization of spectroscopic techniques to improve understanding of the wound healing process, particularly in traumatic acute wounds, as well as identifying and quantifying transplant-associated ischemia and reperfusion injury. Her experience as an applied spectroscopist includes applications in forensics, pharmaceuticals, and biomedicine. After receiving her doctorate from the University of Michigan in 2005, she was awarded postdoctoral fellowships to both the FBI Academy and the National Institutes of Health. Subsequently, Dr. Crane became the team leader of the Spectroscopy and Process Analytical Technology (PAT) group of Global Quality Analytical Development within Wyeth Pharmaceuticals. Her scientific interests include vibrational spectroscopy and spectroscopic imaging, in addition to PAT. Dr. Crane has more than a dozen publications and presentations, as well as two patents.
Faiza Poshni was a consultant working in the Global Quality and Analytical Development at Pfizer in Pearl River, New York. Prior to working at Pfizer (Wyeth), Ms. Poshni worked as a Preformulation scientist at Boehringer Ingelheim Pharmaceuticals, Inc. She has a M.S. in Chemisty from StonyBrook University.
Yanxi Tan Cain is Director of Scientific & Laboratory Services in Global Quality Operations, Pfizer in Pearl River, New York. She is leading a technical and scientific team that provides innovative solutions and quality-based services in support of business to ensure that Pfizer products are of the highest quality. Previously, she was Department Director of Global Quality Analytical Development, Wyeth Pharmaceuticals with a focus in developing robust analytical methods to support API and drug product process development, and physicochemical characterization, spectroscopy and Process Analytical Technology applications. She also worked in Wyeth Research for over 10 years. With over 15 years diverse global experience as a leader of cross-disciplinary project teams, Dr. Cain has numerous research committee presentations as well as invited presentations at scientific conferences, multiple awards for scientific and leadership achievements. She received her Ph.D. from McGill University in 1997.