Introduction
Dissolution testing has become a fundamental and indispensable tool for the evaluation of the in vitro quality of solid oral dosage forms, and as such is accepted as a critical factor worldwide.
After approximately a century of development, the relevance of dissolution testing is indisputable, and although there remains much research to be done in the field, the relationship between dissolution behavior and in vivo performance of drugs is now well established: active ingredients included in a pharmaceutical dosage form must be released and dissolved prior to being absorbed. The rate at which poorly water-soluble drugs are dissolved in the gastrointestinal tract from the dosage form is correlated with the rate of systemic absorption and, therefore, with the bioavailability of the drugs. This factor is the main reason for the increased relevance of dissolution testing, as it predicts the way that a drug product will behave in vivo (at least for highly permeable drugs) and even replace in vivo studies in certain circumstances [1]. As a result, having suitable and biorelevant methods to compare the dissolution profiles obtained is expected to grow more important.
Main Methods Used to Compare In Vitro Dissolution Profiles
In the 1990s, many proposals began to appear in scientific literature, outlining methods useful for the comparison of dissolution profiles [2]. Moreover, new methods continue to emerge even after drug regulatory agencies recommended the similarity factor (f2) developed by Moore and Flanner as the preferred method for dissolution profiles comparison [3-7]. Regardless of the particular characteristics of each method, they can generally be classified into one of three categories: model independent methods (MIM), model dependent methods (MDM) and, maybe less important, ANOVAbased statistical methods (ASM).
As suggested by the categories’ nomenclature, the main difference between MIM and MDM lies in the fact that, while the former can be calculated directly from the dissolution data, the latter require prior adjustment of the data to a model or equation that describes its temporal evolution. Therefore, the simplicity of calculation is the first advantage that one finds when working with MIM, such as the difference and similarity factors, f1 and f2, and the statistical comparisons of parameters obtained from the profiles as the area under the curve (AUC) and its related parameter, the dissolution efficiency (DE).
The f2 and f1 factors are very easy to compute and two given profiles are considered similar if the f2 value between them is greater than or equal to 50 and the f1 less than 15 [6, 8]. It is important to note that the value of the similarity factor f2 could be different depending on which of the two products is considered the reference for the comparison.
The “classical” calculation method of the f2 factor does not reveal the related standard deviation and thus no confidence interval could be associated with the metric. The use of the statistical bootstrap technique overcomes this major drawback: in a recent publication, Mendyk et al. presented an open source program to perform bootstrap calculations of the f2 factor, designed to help with f2 computation in cases where intra- and inter-batch variability is large (e.g. greater than 10%). The algorithm provides possible “worst case scenarios” of f2 values, thus supporting claims about pharmaceutical equivalence [9].
On the other hand, MDM are those with the most complicated calculation. In general, no universal model is set to fit all dissolution profiles and there are no established criteria to select the proper mathematical model. Therefore, experimental data should be fitted to more than one non-linear model, (e.g. First Order, Weibull, Gompertz, Logistic equations), and after that the best-fitting equation must be chosen on a statistical basis: R2, AIC (Akaike Information Criterion) and/or lack of fit analysis. Once the mathematical method is selected, the equation’s parameters of each tablet, of each product, should be recorded and compared using appropriate multivariate statistical methods (e.g. Hotelling’s T2 test, regions of similarity method, among others) [10,11].
Finally, the ASM treat the percent dissolved as a random variable to perform the analysis of variance, considering the formulation a single class variable (one way ANOVA) or both the formulation and the time as class variables (two way ANOVA), under the null hypothesis of similarity. Although these methods are easy to calculate with friendly software, their application is not strictly correct because the assumption of independent variables it is not fulfilled due to the correlation between the percent dissolved and the time.
Are these Methods Equally Suitable for their Application to Dissolution Profile Comparison of Multisource Drug Products?
To answer this question, the performance of MIM, MDM and ASM will be analyzed using some of the many dissolution results that we have obtained in our laboratory over the years as examples. Without going into experimental details, the methods were applied to the comparison of dissolution profiles of oxcarbazepine 600 mg tablets (OxCBZ, 4 brands), carbamazepine 200 mg tablets (CBZ, 4 brands), acenocoumarol 4 mg tablets (ACM, 4 brands), and sodium phenytoin 100 mg capsules (PHT, 2 brands). All of the dissolution tests were conducted according to USP 34 conditions, and the following paragraphs present a summary of the main results (the interested reader can find the tables containing the complete results elsewhere [12]).
With regard to the MDM, only in the case of OxCBZ was it possible to fit the profiles of the individual brands to the same mathematical model. For the other drugs tested, fitting to a common model could not be attained, and therefore the comparison by MDM could not be performed. Furthermore, although the fitting of OxCBZ to one equation was possible, the results from the subsequent statistical comparison did not allow demonstrating similarity between any pair of OxCBZ products.
On the other hand, and their application is not strictly correct for the previously mentioned reasons, two-way and one-way ANOVA were performed to all the products. As in the case of MDM, similarity could not be established between any pair of products by these methods.
Finally, when MIM were applied, several similarities could be established, although different methods (f factors, AUC, DE) did not always yield coincident results.
At this point, two conclusions could be drawn: the fitting of dissolution data of multisource drug products to one and common model or equation (necessary step prior to profiles comparison by MDM) could not always be achieved; and both MDM and ASM are so discriminating that the differences usually found in products from different sources, although biopharmaceutically irrelevant, do not allow concluding similarity.
Hence the MIM appear to be the most suitable for assessing the equivalence in dissolution behavior between multisource drug products. However, in all cases (all drugs, all products) the results of AUC and DE comparison were not always coincident with the f indexes.
In Vitro-In Vivo Correlations as a Tool to Assess the Biorelevance of Dissolution Profile Comparison
The results discussed in the previous section assessed some main characteristics of the dissolution profile comparison methods analyzed, but their biorelevance (i.e. their ability to predict the in vivo behavior of the drug products) still remains undiscussed.
To address this matter, key remarks of a qualitative correlation between the in vitro data of some of the solid oral drug products mentioned previously and their respective in vivo data will be discussed. The in vivo profiles of the CBZ and PHT products (same brand, same batch) were previously obtained in our laboratory by administering the products to healthy volunteers and measuring the drug levels in saliva samples of the volunteers [13, 14].
When establishing a correlation between the in vivo and in vitro results obtained for CBZ products, it was found that:
- Products that were bioequivalent (BE) in terms of rate (the Cmax/ABC0-t and Tmax parameters BE), but not in amount absorbed (AUC0-t, AUC0-inf and Cmax not BE), presented in vitro dissolution profiles that were similar according to the f factors but not in terms of their AUC or DE (products CBZ-A and CBZ-B, red lines in Figure 1).
- Products that were BE in amount absorbed (AUC0-t and Cmax BE), and almost in absorption rate (the 90% confidence interval for the Cmax/ABC0-t parameter was 78.2-122.9%), presented similar AUC and DE but did not meet the f2 similarity criteria (products CBZ-C and CBZ-D, blue lines in Figure 1).
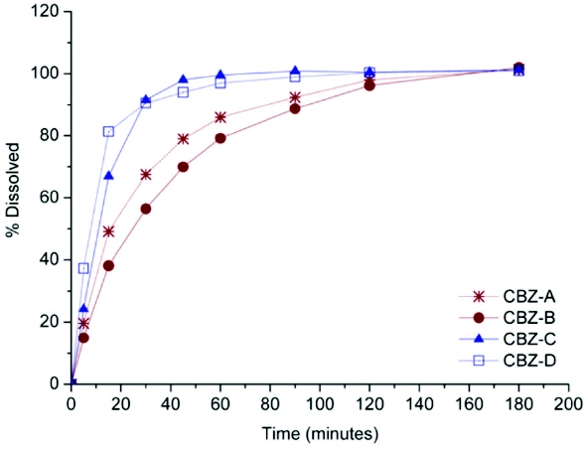 Figure 1. Dissolution profiles in USP 34 conditions (apparatus 2, paddle, 900 ml of 1% Sodium Lauryl Sulfate, 75 rpm) of four brands of 200 mg CBZ tablets.
This clearly illustrates the nature of both types of comparisons. The f2 factor accounts for the differences in the percentage dissolved by measuring vertical distances, regardless of its position in the time axis, which makes this index very sensitive to the differences in the first time points (case of the CBZ-C and D products, see Figure 1). Differences in the first times sampled, that have little or no impact on the profile AUC, could have a major impact on the f2 value, which sometimes is calculated only with a few points, as in the case of rapidly dissolving products (i.e. up to 85% before 30 minutes).
Therefore, whereas the f2 factor is mainly related to the in vivo absorption rate, the AUC and DE parameters are predominantly related to the in vivo absorbed amount.
The results obtained for PHT illustrate another related factor: the two products tested were BE in vivo (even according to the individual bioequivalence methodology applied) but their dissolution profiles only resulted equivalent in terms of their AUC and DE (p>0.05), with a f2<50 (Figure 2).
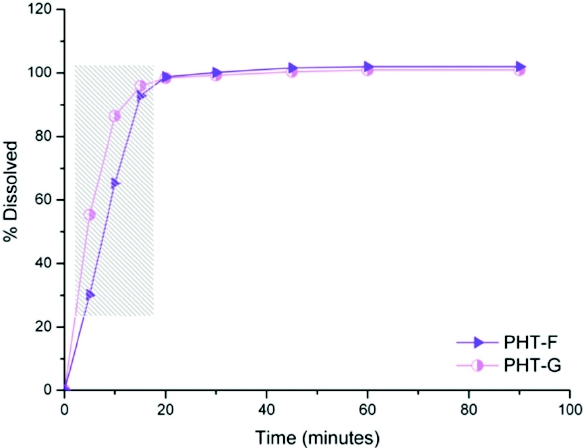 Figure 2. Dissolution profi les in USP 34 conditions (apparatus 1, basket, 900 ml of distilled water, 50 rpm) of two brands of 100 mg PHT capsules. The gray-shaded rectangle highlights the differences in the first three time points detected by the f2 factor.
These results do not disagree with the previous ones. The BE between the two products means similar rate and amount absorbed in vivo, which could probably be due to the high in vitro dissolution rate found for both products (>85% in 30 minutes, highlighted in grey in Figure 2). That is, the differences detected by the f2 factor were not biorelevant due to the rapid dissolution in water of the products, being more suitable the comparison of AUC and DE.
Concluding Remarks
This brief review has attempted to provide a comprehensive overview of the advantages and disadvantages of the main methods available to compare dissolution profiles in situations where comparisons are aimed to assess the in vitro biopharmaceutical performance of multisource products in order to ensure similar in vivo performance of the products, as in the case of biowaivers [1, 6].
Results illustrated that MIM are the most suitable for profiles comparison in such situations. ASM are not adequate to the dissolution experimental data processing. MDM are overdiscriminating and not easy to calculate, with the additional disadvantage of requiring fitting the data to some descriptive equation, which makes them unsuitable for the comparison of dissolution profiles of multisource drug products that do not fit to the same model, as occurred with CBZ and ACM results.
Therefore, when the biopharmaceutical quality of multisource drug products are to be compared through in vitro dissolution studies, the current recommended method (similarity factor, f2) is adequate, although it may be insufficient or its interpretation ambiguous in certain situations. A recent study by Duan et al. analyzed the correspondence between the f2 and in vivo results obtained by simulations, and concluded that although the results were consistent in most cases, care should be taken when the completeness of the dissolution profiles differ more than 10% and/ or when the shapes of the dissolution profiles are significantly different [15].
These ambiguous situations, as well as the extreme sensitivity of the f2 factor to the first, and sometimes not critical, points of the dissolution profiles lead us to the main conclusion, which is always inform the result of AUC or DE comparison along with the f2 factor. By doing so, a better prediction of in vivo performance could be achieved in terms of both rate and amount of drug dissolved, which is the ultimate goal when comparing multisource and potentially therapeutic equivalents.
Moreover, these simple calculations do not require specific software or training, and they may become a robust tool in establishing the similarity between dissolution profiles, particularly in those situations where the f2 value is near the specification (50) or when is greater or less than 50 depending on which product is taken as the reference for the calculation.
Author Biography
Esperanza Ruiz, Ph.D., obtained her degree of Pharmacist and Licentiate in Pharmaceutical Sciences from the National University of La Plata, Argentina, receiving two awards for academic excellence. Esperanza holds a Ph.D. degree from the same University, where she currently works as a full time researcher and teaches Quality Control of Medications and Experimental Design. Her scientific contributions comprise over 30 publications, including journal articles and presentations in conferences and meetings.
References
- FDA/CDER, Guidance for Industry: Waiver of In Vivo Bioavailability and Bioequivalence studies for immediate-release solid oral dosage forms based on a Biopharmaceutics Classification System, (2000).
- T. O’Hara, A. Dunne, J. Butler, J. Devane, A review of methods used to compare dissolution profile data, Pharmaceutical Science & Technology Today. 1 (1998) 214–223.
- M.R. Berry, M.D. Likar, Statistical assessment of dissolution and drug release profile similarity using a model-dependent approach, J Pharm Biomed Anal. 45 (2007) 194–200.
- R.M. Maggio, P.M. Castellano, T.S. Kaufman, A new principal component analysis-based approach for testing “similarity” of drug dissolution profiles, European Journal of Pharmaceutical Sciences. 34 (2008) 66–77.
- O. Korhonen, S. Matero, A. Poso, J. Ketolainen, Partial least square projections to latent structures analysis (PLS) in evaluating and predicting drug release from starch acetate matrix tablets, J Pharm Sci. 94 (2005) 2716–2730.
- FDA/CDER, Guidance for Industry: Dissolution testing of immediate release solid oral dosage forms, (1997).
- EMEA/CPMP, Guideline on the Investigation of Bioequivalence, (2008).
- J.W. Moore, H.H. Flanner, Mathematical comparison of dissolution profiles, Pharm Technol. 20 (1996) 64–75.
- A. Mendyk, R. Jachowicz, K. Fijorek, P. Dorożyński, P. Kulinowski, S. Polak, KinetDS: an Open Source software for dissolution test data analysis, Dissolution Technologies. 19 (2012) 6–11.
- H. Saranadasa, Defining similarity of dissolution profiles through Hotteling’s T2 statistic, Pharm Technol. 25 (2001) 46–54.
- P.M. Sathe, Y. Tsong, V.P. Shah, In-vitro dissolution profile comparison: statistics and analysis, model dependent approach, Pharm Res. 13 (1996) 1799–1803.
- M.E. Ruiz, M.G. Volonte, Biopharmaceutical relevance of the comparison of dissolution profiles: proposal of a combined approach, Dissolution Technologies. (2014). In press.
- M.E. Ruiz, P. Conforti, P. Fagiolino, M.G. Volonté, The use of saliva as a biological fluid in relative bioavailability studies: comparison and correlation with plasma results, Biopharm Drug Dispos. 31 (2010) 476–485.
- M.E. Ruiz, P. Fagiolino, P.M. de Buschiazzo, M.G. Volonte, Is saliva suitable as a biological fluid in relative bioavailability studies? Analysis of its performance in a 4 x 2 replicate crossover design, Eur J Drug Metab Pharmacokinet. 36 (2011) 229–236.
- J. Duan, K. Riviere, P. Marroum, In Vivo Bioequivalence and In Vitro Similarity Factor (f2) for Dissolution Profile Comparisons of Extended Release Formulations: How and When Do They Match?, Pharmaceutical Research. 28 (2011) 1144–1156.