Abstract
Dried blood spot (DBS) collection is a microsampling technique recognized as having several advantages compared to frozen specimen handling, including low blood volume sampling requirements, reduced biohazard risk, as well as lower cost and ease of sample storage and transport. These qualities have increased the attention and application of DBS for pharmacokinetic and toxicokinetic studies in small molecule drug discovery and development. Although there are a number of reports discussing factors that affect the accuracy and precision of the DBS sampling technique, studies evaluating the impact of the physiochemical properties of analytes on DBS assay performance are limited. In this investigation, we evaluated the DBS sampling technique using compounds with various polar surface area (PSA), cLogP and cLogD7.4 values. In addition, the impact of card lot variability on DBS assay performance was also studied. Detailed discussions on the results of the DBS sampling technique using compounds of various physiochemical properties and DBS cards of different lots are presented.
Introduction
Dried blood spot (DBS) sampling [1-4] is the collection of blood onto paper prior to subsequent analysis and has been used for decades in the healthcare industry. From the early uses in newborn screening for phenylketonuria [5] to the analysis of infectious diseases such as HIV [6], interest in the application of DBS has grown as a result of the practical benefits that can be realized in the pre-clinical [7,8] and clinical environment [9,10] combined with recent advances in bioanalytical technology. Due to the advantages of low blood volume microsampling, DBS has appealed to many pharmaceutical companies as a means to refine experimental designs in terms of reducing the number of animals required for toxicology studies, and has potential to reduce costs for sample shipment and storage. In addition, DBS can enhance the stability of drugs and labile metabolites, such as glucuronide conjugates [11,12]. However, the relatively low sample volume with DBS is potentially a challenge for quantitatively measuring drug concentrations in biological samples. The recent development of more sensitive mass spectrometry instrumentation has enabled the routine detection and quantification of low drug concentrations from only a few microliters of blood and allowed researchers to fully exploit the advantages of DBS.
Although definite advantages can be realized in the use of DBS, there are also some unique issues that must be considered. One major concern for the use of DBS, both preclinically or clinically, is the variation in hematocrit [13]. The effects of low or high hematocrit levels in whole blood will significantly influence the sample viscosity and thus the DBS spot size [13]. Furthermore, variation in blood-to-plasma ratio due to factors such as concentration dependence, may lead to erroneous comparison of DBS and plasma concentration or pharmacokinetic data [14]. However, the implications of using DBS for pharmacokinetic studies have been discussed in two recent publications [15,16], concluding that DBS could be effectively used for many compounds.
Table 1. Physiochemical Properties of Compounds A-E
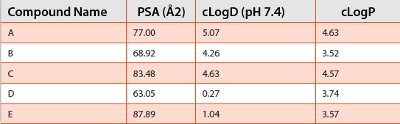
Accuracy and precision of DBS assays may also be affected by other less well characterized variables. Thorough evaluation of the DBS technique using compounds of various physiochemical properties is limited [17,18]. One goal of this work was to investigate DBS sampling technique using five Amgen compounds (A-E) of different physiochemical properties such as polar surface area (PSA), cLogP and cLogD7.4 (Table 1). All three properties can be readily calculated for target molecules and do not need to be determined experimentally. PSA is the sum of the surface area of all polar atoms in a molecule and is a measure of the ability of a molecule to permeate the cell membrane. Molecules with a PSA value less than 60 Å2 generally have a higher ability to penetrate the blood-brain barrier while molecules with a PSA value greater than 140 Å2 tend to have poor cell permeability [19,20]. cLogP is the calculated log P (logarithm of the octanol/water partition coefficient of unionized solute) while cLogD7.4 is the calculated log D (logarithm of the octanol/ water distribution coefficient of both ionized and neutral solute at pH 7.4, the physiological pH of blood). In addition to investigating the effect of drug properties, the impact of card lot variability on the quantitative performance of the DBS assay was also evaluated for several of the same compounds (A, B and C).
Experimental
Chemicals and Materials
Compounds A – E and the analogue internal standards were synthesized at Amgen (Thousand Oaks, CA). Methanol, acetonitrile, dimethyl sulfoxide (DMSO), formic acid and ammonium formate were obtained from commercial vendors. Sprague Dawley rat whole blood (K2-EDTA anticoagulant) and Beagle dog whole blood (K2-EDTA anticoagulant) were supplied by a commercial supplier. Uncoated cellulose DBS cards and 3-mm diameter punch tools were obtained from a commercial vendor.
Compound Physicochemical Properties
Compounds A – E physicochemical properties (PSA, cLogD7.4, and cLogP) were calculated using commercial vendor software.
Calibration Standards and QC Samples
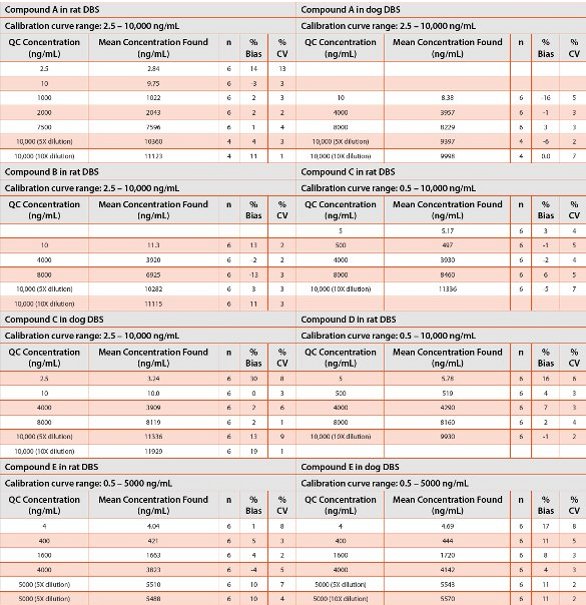
Table 2 - Accuracy and Precision of QC samples of Compounds A-E in Rat and Dog DBS.
Stock solutions (1.00 mg/mL) of compounds A – E and the internal standards (IS) were prepared in DMSO. For the preparation of whole blood calibration standards, serial dilutions of the stock standard solution using methanol/water (1:1) yielded the spiking standard solutions. Calibration standards for each compound were obtained separately by spiking serially diluted stock standards into rat or dog whole blood. The calibration standard and quality control (QC) samples were prepared in rat and dog plasma at concentrations indicated in Table 2. Aliquots of 15 μL of the whole blood standard and QC samples were spotted on DBS cards and allowed to air dry at room temperature for at least 2 hours. A working IS solution was prepared in 75% methanol/water (v/v) for the extraction of DBS samples.
Sample Preparation
A 3-mm diameter disk was punched from the center of the DBS card into a 1.2 mL cluster tube and then a 100 μL aliquot of the working IS in 75% methanol/water was added. The tube was vortex mixed for about 30 minutes. Supernatants were transferred into a 96 well plate after centrifugation at 3000 rpm (~1,700 g) for 10 minutes. The extract (2 μL – 10 μL) was injected into the LC-MS/MS system.
Dilution QC samples (5,000 or 10,000 ng/mL) were extracted with 100 μL aliquot of the working IS solution. Diluent was prepared by extracting 3-mm punches of blank DBS with 100 μL aliquot of the working IS solution. The blank extracts were then pooled to obtain a sufficient volume of diluent. For a dilution factor of 10, a 10 μL aliquot of the extracted dilution QC samples was added to 90 μL of the blank diluent. For a dilution factor of 5, 20 μL of the extracted dilution QC samples were added to 80 μL of the diluent.
Analytical Instrumentation
All experiments were performed using a commercial UHPLC-MS/MS system. For the analysis of compounds A-C (dog whole blood only for compound C), the analytical column was a reversed-phase C18; (50 x 3.0 mm, 2.6 μm) maintained at a temperature of 50°C. The mobile phases were (A) 10 mM ammonium formate in acetonitrile/water (5/95) pH 5 and (B) 10 mM ammonium formate in acetonitrile/water (95/5) pH 5. Flow rate was 1.0 mL/min using gradient elution conditions. The gradient started at 20% B and increased to 70% B from 0.25-0.65 minutes, and was held constant until 1.50 minutes. At 1.50 minutes, the gradient was changed back to the starting conditions. The run time was about 2.0 minutes.
For the analysis of compounds C and D in rat whole blood, the analytical column was a reverse phase phenyl; (50 x 2.1 mm, 1.8 μm) maintained at a temperature of 30°C. The mobile phases were (A) water with 0.1% formic acid and (B) acetonitrile with 0.1% formic acid. Flow rate was 0.5 mL/min using gradient elution conditions. The gradient started at 10% B and increased to 95% B from 0.4 -1.8 minutes, and was held constant until 2.50 minutes. At 2.50 minutes, the gradient was changed back to the starting conditions. The run time was about 3.0 minutes.
For the analysis of compound E, the analytical column was C18 column; (50x 2.0 mm, 3 μm) maintained at a column temperature of 40 oC. The mobile phases were (A) 0.1% formic acid in water and (B) 0.1% formic acid in acetonitrile Flow rate was 0.6 mL/min using gradient elution conditions. The gradient started at 5% B and increased to 20% B from 1.00 – 2.00 minute, and increased to 100% B from 2.00 – 3.00 minute. At 3.01 minutes, the gradient was changed back to the starting conditions. The run time was about 6.0 minutes. All analytes were quantitated by multiple reaction monitoring (MRM) with either atmospheric pressure chemical ionization (for compounds A-D) or electrospray ionization (for compound E) in the positive ion mode. Calibration curves were constructed with a weighted 1/concentration2 linear (for compounds A-D) or quadratic (for compound E) regression.
Results and Discussions
The calibration standards and QC samples were quantified using discovery level acceptance criteria of ±20% of nominal concentration for accuracy and precision. The accuracy (% bias) and precision (% CV) data for all five compounds in rat and beagle dog DBS are shown in Table 2. The % bias and % CV are all less than 20% except compound C in dog DBS at the lower limit of quantitation (2.5 ng/mL) which has a bias of 30%. The calibration curve ranges (2.5 – 10,000 ng/mL, 0.5 – 10,000 ng/mL and 0.5 – 5000 ng/mL) for the compounds studied are shown in Table 2. These ranges were chosen as these are typical concentrations observed in most discovery pharmacokinetic (PK) studies. The lower limits of quantitation (LLOQ) of 2.5 and 0.5 ng/mL are also sensitive enough to accurately determine the concentrations for a range of compounds exhibiting diverse pharmacokinetic profiles. The dynamic ranges were over 3 orders of magnitude and the coefficients of determination (r2) of the calibration curves were >0.99 indicating a good fit of the regression model. Large dynamic ranges are usually preferred in discovery studies to minimize the need to reassay samples reading above the upper limit of quantitation (AQL). For samples which do need dilutions, dilution factors of 5 and 10 were evaluated in these studies. The % bias for all compounds with a dilution factor of 5 was within ±13% and the % CV was less than 9%. For a dilution factor of 10, the % bias was within ±19% and the % CV was less than 7%. Overall, the results showed that DBS sampling technique is applicable for compounds of a wide range of lipophilicity with cLogD7.4 values ranging from 0.27 to 5.07.
Table 3 - Evaluation of card lots variability using compounds A, B and C in rat and dog DBS
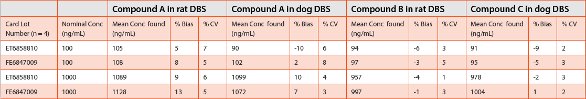
Assay variability was also assessed using two different lots of DBS cards and compounds A, B and C at concentrations of 100 and 1000 ng/ mL. The results are shown in Table 3. The % bias were all within ±13% while the % CV is less than 8%. These results indicate that there was no significant effect of card lot variability on DBS assay performance with the card lots studied.
Uncoated DBS cards were chosen for the studies as interference from chemicals on treated cards has been reported [21]. The extraction solvent used was 75% methanol/water as this solvent was commonly used in the extraction of DBS samples [9]. We have also tested this solvent mixture and found that it provided high analyte extraction recovery [7,8]. These studies also showed that 75% methanol/water can be used for the extraction of compounds of a wide range of polarity. A vortex extraction time of 30 minutes was used as longer extraction time (60 minutes) did not increase the extraction recovery [7]. In the current study, a shorter extraction time of 10 minutes was found to be sufficient, although this may be compound dependent and should be optimized for individual compounds. The 3-mm diameter punch used in this study provides adequate sample volume to achieve the required lower limits of quantitation for discovery PK studies. Larger diameter punch size (e.g. 6-mm) can be used when enhanced assay sensitivity is needed.
Conclusions
A successful evaluation of the DBS sampling technique using rat and dog whole blood and compounds with a range of physiochemical properties has been completed. Accuracy and precision of the QC samples were satisfactory using discovery level assay acceptance criteria for accuracy and precision of ± 20%. Sufficient sensitivity was obtained in all cases to help characterize compounds of a diverse pharmacokinetic profile. These results demonstrate that DBS sampling technique can be used to support routine discovery studies for a variety of small molecule chemotypes. There was no significant effect of the two selected lots on assay performance indicating that these DBS cards were consistently manufactured and can provide a platform for accurate sampling and quantitative analysis.
References
- Li W, Tse FLS. Dried blood spot sampling in combination with LC-MS/MS for quantitative analysis of small molecules. Biomed. Chromatogr. 24(1), 49-65 (2010).
- Edelbroek P.M., Heijden J., Stolk L.M., Dried Blood Spot Methods in Therapeutic Drug Monitoring: Methods, Assays, and Pitfalls, Therapeutic Drug Monitoring, 31 (2009) 327-336.
- P. Patel, Mulla H, Tanna S, Pandya H, Facilitating pharmacokinetic studies in children: a new use of dried blood spots. Arch. Dis. Child. 95(6), 484-487 (2010).
- Pandya HC, Spooner N, Mulla H, Dried blood spots, pharmacokinetic studies and better medicines for children. Bioanalysis 3(7), 779-786 (2011).
- Guthrie R., Susi A., A simple phenylalanine method for detecting phenylketonuria in large populations of newborn infants, Pediatrics 32(3), 338-343 (1963).
- Johannessen A., Dried blood spots in HIV monitoring: applications in resources-limited settings, Bioanalysis. 2, 1893-1908 (2010).
- Wong P, Pham R, Whitely C, Soto M, Salyers K, James C, Bruenner B. A. Pharma. Biomed. Anal. 56(3), 604-608 (2011).
- Uyeda C, Pham R, Fide S, Henne K, Xu G, Soto M, James C, Wong P. Application of automated dried blood spot sampling and LC-MS/MS for pharmacokinetic studies of AMG 517 in rats. Bioanalysis 3 (20), 2349-2356 (2011).
- Spooner N, Lad R, Barfield M, Dried blood spots as a sample collection technique for the determination of pharmacokinetics in clinical studies: considerations for the validation of a quantitative bioanalytical method. Anal. Chem. 81,1557-1563 (2009).
- Amsterdam PV, Waldrop C. The application of dried blood spot sampling in global clinical trials. Bioanalysis 2(11), 1783-1786 (2010).
- D’Arienzo CJ, Ji QC, Discenza I et al. DBS sampling can be used to stabilize prodrugs in drug discovery rodent studies without the addition of esterase inhibitors. Bioanalysis, 2(8), 1415-1422 (2010).
- Bowen CL, Cades J, Volpatti J, Licea-Perez, Evans CA. Feasibility of dried blood and plasma spots to the enhanced stability of glucuronide stability, Presented at the 59th ASMS Conference on Mass Spectrometry and Allied Topics, Denver, CO, June 5-9, 2011.
- Denniff P., Spooner N., The effect of hematocrit on assay bias when using DBS samples for the quantitative bioanalysis of drugs, Bioanalysis. 2(8), 1385-1395 (2010).
- Phadnis R, Moore E, Pham R et al. Application of DBS to the pharmacokinetic evaluation of compounds with various blood-to-plasma ratios using LC-MS/MS. Presented at the 59th ASMS Conference on Mass Spectrometry and Allied Topics, Denver, CO, June 5-9, 2011.
- Rowland M, Emmons GT, Use of dried blood spots in drug development: Pharmacokinetic considerations, AAPS J. 12(3), 290-293 (2010).
- Emmons G, Rowland M, Pharmacokinetic considerations as to when to use dried blood spot sampling, Bioanalysis 2(11), 1791-1796 (2010).
- Wickremsinhe ER, Abdul BG, Huang NH et al, Dried blood spot sampling: coupling bioanalytical feasibility, blood-plasma partitioning and transferability to in vivo preclinical studies. Bioanalysis 3(14), 1635-1646 (2011).
- Blessborn D., Romsing S., Bergquvist Y., Lindegardh N., Assay for screening for six antimalarial drugs and one metabolite using dried blood spot sampling, sequential extraction and ion-trap detection, Bioanalysis. 2(11), 1839-1847 (2010).
- Ertl P, Rohde B, Selzer P, Fast calculation of molecular polar surface area as a sum of fragment based contributions and its application to the prediction of drug transport properties. J. Med. Chem. 43, 3714-3717 (2000).
- Ertl P. Polar Surface Area, in Molecular Drug Properties, R. Mannhold (ed), Wiley-VCH, pp 111-126, 2007.
- Kehler JR, Bowen CL, Boram S, Evans CA. Application of DBS for quantitative assessment of the peptides Exendin-4; comparison of plasma and DBS method by UHPLC-MS/MS. Bioanalysis, 2(8), 1461-1468 (2010).
Author Biographies
Roger Pham is a Senior Associate Scientist at Amgen (Thousand Oaks, CA) in PKDM Research. He received his Bachelor degree in Environmental Science from University of California Santa Barbara. His current research area is in the evaluation and application of DBS in pharmacokinetic and toxicokinetic studies.
Philip Wong is a Principal Scientist at Amgen (Thousand Oaks, CA) in PKDM Research. He received his Ph.D. degree in Chemistry from Purdue University. His current role is to support both GLP and non-GLP studies with LC-MS/MS analysis.
Guifen Xu is a Senior Scientist at Amgen (South San Francisco, CA) in PKDM Research. She received her Ph.D. degree in Chemistry from University of California, Irvine. Her current role is to support small molecule non-GLP discovery studies using LC-MS/MS.
Earl Moore is a Scientist at Amgen (Cambridge, MA) in PKDM Research. He received his Bachelor degree in Chemistry from University of Maine Orono. His current role is to support in vivo and in vitro drug discovery analyses using LC-MS/MS and FT-HRMS.
Mary Wells is a Principal Scientist at Amgen (Cambridge, MA) in PKDM Research. She received her Ph.D. degree in Chemistry with an emphasis in Analytical Chemistry and Biochemistry from the University of South Carolina. Her current roles include bioanalytical team leader and PKDM project representative.
Bernd Bruenner is a Principal Scientist at Amgen (Thousand Oaks, CA) in PKDM Research. He received his Ph.D. degree in Agricultural and Environmental Chemistry from the University of California, Davis. Currently he is a group leader responsible for providing bioanalytical support for discovery and development projects as well as in vitro metabolic assays.
Christopher James is a Director at Amgen (Thousand Oaks, CA) in PKDM Research. He received his Ph.D. degree from London University and currently leads a group providing bioanalytical methods in support of small molecule drug discovery and development.
This article was printed in the November/December 2011 issue of American Pharmaceutical Review - Volume 14, Issue 7. Copyright rests with the publisher. For more information about American Pharmaceutical Review and to read similar articles, visit www.americanpharmaceuticalreview.com and subscribe for free.