Abstract: The optical spectroscopy toolbox contains a large variety of methods that exploit light-matter interactions such as absorption, emission, and scattering phenomena across the entire electromagnetic spectrum. This work aims to give an overview of the available techniques and their potential applications for product and process analysis in the pharmaceutical sector.
Spectroscopic methods are essential tools in pharmaceutical analysis, offering rapid, non-destructive, and detailed insights into the composition and structure of pharmaceutical substances as well as information about the progress of the production process. Generally speaking, optical spectroscopy can be defined as the study of the interaction between electromagnetic radiation and matter. It involves analyzing how materials absorb, emit, or scatter light across different wavelengths to determine their composition, structure, or physical properties.
The Electromagnetic Spectrum
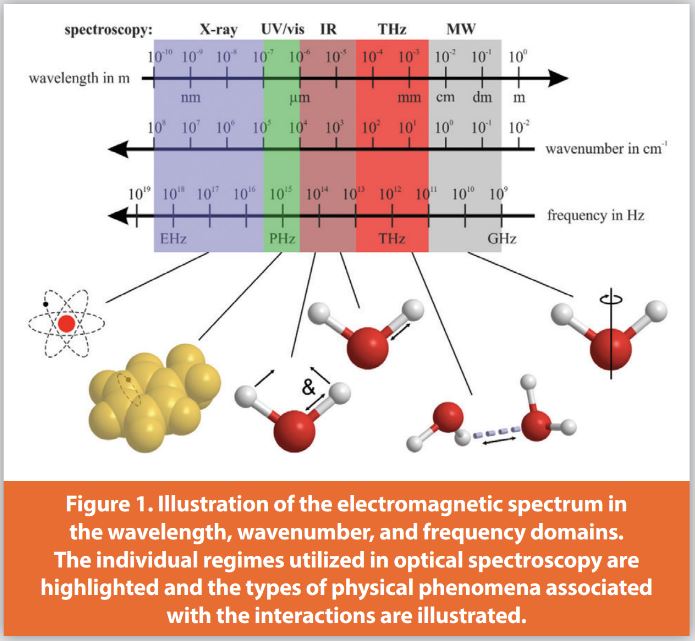
Figure 1 illustrates the electromagnetic spectrum and identifies the regimes that are commonly distinguished in the spectroscopy community according to the types of physicochemical phenomena associated with the light-matter interaction. Note that the regimes indicated do not have sharp boundaries and hence they may be defined differently in other sources.
- The X-ray regime ranges from about 0.1 nm to 100 nm (3∙106 - 3∙103 THz). The photon energy (E=hν with the Planck constant h and the frequency ν) is sufficiently high to cause the excitation of electrons and even ionization of atoms. As a consequence, this range is suited for elemental rather than molecular analysis. X-ray absorption and fluorescence are common approaches with a variety of applications in the life sciences. In many cases, a lab environment is necessary to handle X-ray radiation.
- The UV and visible regime (100 nm – 1 µm; 3∙103 – 300 THz) is dominated by electronic interactions in molecules. In particular, chromophores and molecules with aromatic and conjugated pi-electron systems can be targeted. This regime is often cost-effective as light sources and detectors are widely available.
- The infrared regime (1 – 30 µm; 300 – 10 THz) is commonly subdivided into the near- and mid-infrared spectral windows, which are characterized by overtone/combination vibrations and normal vibrations, respectively. The signals in the NIR are usually less specific, but on the other hand, light sources and detectors are widely available as this range is commonly used in the field of telecommunication. Moreover, thermal background interference is reduced compared to the mid-IR.
- The photon energy in the terahertz regime (30 – 3000 µm; 10 – 0.1 THz) corresponds to the vibrations of intermolecular bonds such as hydrogen bonds and dipole-dipole interactions. Virtually all relevant materials are at least semi-transparent at THz frequencies so that both surface and bulk measurements are possible.
- And last but not least, the microwave regime (3 – 300 mm; 0.1 – 0.001 THz) can be utilized to study molecular rotations.
It is clear that the light-matter interactions in all the above-mentioned regimes are associated with specific phenomena at the atomic or molecular scale. Hence, the analytical methods arising from these phenomena provide chemical information concerning structure (via the spectral position of the signal) and quantity (via the signal amplitude).
Light-Matter Interactions
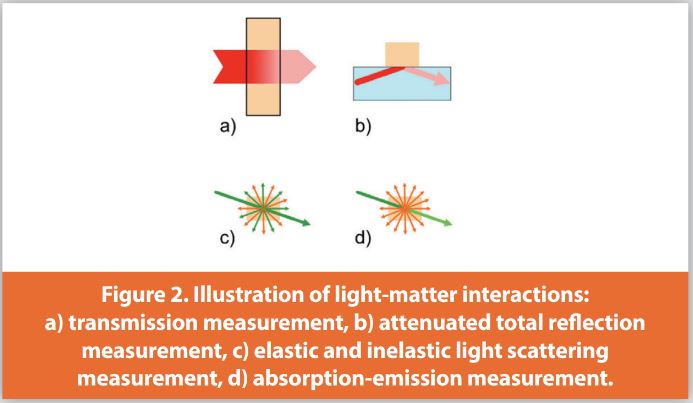
Light-matter interactions typically yield signals that allow molecular fingerprinting and they can be exploited in many ways as depicted in Figure 2. Determining the absorption spectrum from a simple measurement of the transmitted radiation is probably the most common type of spectroscopy. Most straightforwardly, the sample is illuminated by the radiation, and the intensity is measured before and after the sample. The measured transmission is then plotted as a function of wavelength, wavenumber, or frequency to yield the spectrum, which contains molecular fingerprints of all species exhibiting a dipole moment, which is a prerequisite for absorption to take place. Another way to obtain the absorption spectrum is an attenuated total reflection (ATR). In such an arrangement, the radiation propagates in a material with a high refractive index and undergoes total internal reflection at a point where the sample is in contact with the optical material. The sample only interacts with the evanescent field of the radiation and the reflected beam carries the information of the absorption spectrum. Inline probes for process monitoring often utilize ATR due to its robustness and cleanability.
In scattering techniques, the surface or bulk of the sample is irradiated and the elastically and/or inelastically scattered light is analyzed in a spectrometer. For scattering to take place, the molecule needs to be polarizable. Inelastic scattering is usually referred to as Raman scattering, while elastic scattering is called Rayleigh or Mie scattering depending on the size of the scattering particles/molecules in comparison with the wavelength of the radiation. It should be noted that scattering is a virtually instantaneous process, which is different from absorption-emission processes like fluorescence. In the latter, the incoming photon is absorbed so that the atom or molecule reaches an excited state. Before radiation is emitted again, the atom or molecule may undergo non-radiative internal energy conversion as well as collisions with neighboring particles. The time scale of such processes is usually pico- to microseconds. In scattering, on the other hand, the signal photons are emitted within femtoseconds.
Picking a Method and a Suitable Spectral Range
When choosing an analytical method for pharmaceutical analysis, several key factors must be considered to ensure accuracy, reliability, and regulatory compliance. The selection depends on the specific pharmaceutical product, the target analyte(s), and the intended purpose of the analysis.
- Nature of the analyte: Which compounds (organic or inorganic, small or large molecules; some compounds degrade under light, heat, or air exposure) in which physical state (solid, liquid, or gas) and concentration range (trace level (ppm or ppb) vs. bulk content) need to be analyzed.
- Type of analysis required: Qualitative analysis, e.g., the identification of the presence of a compound; quantitative analysis; i.e., determination of the concentration; structural analysis to understand the chemistry; purity and impurity analysis, e.g., to check for contaminants or degradation products. Moreover, the measurement volume and its preferred position are important (e.g., the surface or the bulk of a tablet, the bulk of a solution).
- Sensitivity and detection limits: The method must be sensitive enough to detect the lowest required concentration.
- Specificity and selectivity: The method should be able to distinguish the analyte from other components in the sample, for example,e the pharmaceutically active ingredient from any excipients.
- Sample preparation requirements: Some techniques require extensive sample preparation and need a laboratory environment; others can be applied in line with a production process. Moreover, some methods are non-destructive and others require sample destruction.
- Speed and throughput: Sampling requirements, measurement time, and data analysis need to be considered. For example, monitoring a pharmaceutical production process may require inline data acquisition at Hz or kHz rates.
- Instrumentation availability and cost: High-end techniques may require expensive equipment and trained personnel, while simpler methods may be cost-effective and do the job as well.
- Regulatory and compliance requirements: Methods must comply with pharmacopeial standards and validation per ICH Q2(R1) guidelines is necessary for pharmaceutical applications.
- Robustness and reproducibility: The method should be performed consistently across different laboratories, instruments, and operators.
When high sensitivity and specificity are required, absorption-based methods are typically the best choice. Qualitative information can be derived from the spectral positions of the signal and quantification is possible through the common Beer-Lambert law. The sensitivity can easily be enhanced by extending the path length of the radiation inside the sample. However, the matrix to be analyzed may complicate the measurement. For example, water molecules strongly absorb radiation in a wide range from the infrared to the microwave regime and hence detection of an analyte at low concentration in an aqueous environment may be difficult. In such a situation, scattering techniques like Raman spectroscopy may be an excellent alternative as water has a low scattering cross section and the sensitivity to a specific analyte can be enhanced by selecting appropriate experimental parameters (e.g., the laser wavelength). A good overview of methods and their use as a means of process analytical technology can be found in the following textbooks.1,2
Data Analysis and Evaluation
Spectroscopic data can be analyzed in various ways. Qualitative analysis is usually achieved from the cross-correlation of a measured spectrum with a database of reference spectra. Quantitative analysis can be based on univariate approaches where a spectral signature, for instance, can be assigned to the parameter of interest and a simple calibration can be performed. In more complex situations, i.e., when signatures from multiple species overlap, for example, multivariate techniques are the methods of choice. The list of prominent examples includes partial least-squares regression (PLSR), support vector machines (SVM), and artificial neural networks (ANN). It should be noted that such approaches call for significantly large data sets for training the model to obtain statistically relevant results. Fortunately, such methods are nowadays open source and can be implemented in existing software. For a detailed overview of methods for data analysis, the reader is referred to the literature, e.g.3,4
Conclusion
In this article, a general overview of spectroscopic methods suitable for pharmaceutical analysis was given. Spectral regimes were introduced highlighting the differences in chemical information they can provide in a measurement. Moreover, the principal concepts of spectroscopy in terms of absorption-based and scattering approaches were compared mentioning some of the features and disadvantages that may be important when a method is selected for a specific measurement task. A list of criteria was provided that should be considered during the selection process. This list makes clear that picking the right technique is often not straightforward and significant background knowledge is usually required to make an informed decision. It should also be mentioned that a single method may not be capable of providing all the information desired. Combining more than one approach is often beneficial and it may even be possible to integrate multiple techniques in a single instrument.
References
- K.A. Bakeev (editor), Process Analytical Technology: Spectroscopic Tools and Implementation Strategies for the Chemical and Pharmaceutical Industries, John Wiley & Sons, 2nd edition, 2010.
- S. Ahuja, S. Scypinski (editors), Handbook of Modern Pharmaceutical Analysis, Elsevier, 2nd edition, 2010.
- K.H. Esbensen, B. Swarbrick, F. Westad, Multivariate Data Analysis: An introduction to Multivariate Analysis, Process Analytical Technology and Quality by Design, Camo Software AS, 6th edition, 2018.
- M. Otto, Chemometrics: Statistics and Computer Application in Analytical Chemistry, Wiley VCH, 4th edition, 2023.
Author Details
Johannes Kiefer- University of Bremen, Engineering Thermodynamics and MAPEX Center for Materials and Processes, Bremen, Germany
Johannes Kiefer is a professor of engineering thermodynamics at the University of Bremen, Germany, and a member of the Centre for Process Analytics and Control Technology (CPACT). His research interests include the development of optical spectroscopic methods for engineering and life science applications; in particular, the development of task-specific approaches and multi-parameter measurements including prototype instruments.
Publication Details
This article appeared in American Pharmaceutical Review:Vol. 28, No. 2March 2025Pages: 17-19
Subscribe to our e-newsletters.
Stay up to date with the latest news, articles, and events. Plus, get special
offers from American Pharmaceutical Review delivered to your inbox!
Sign up now!