Introduction
Particle size analysis is routinely employed for material quantification in a growing number of fields (e.g. pharmaceutical, food, metallurgy). The term “particle size” is not an unambiguous one. Problems can arise if the particles have a very large aspect ratio, such as fibers or needles, leading to disagreements between different particle size analyzers [1]. For this reason, we consider that the definition of size is directly dependent upon the methodology employed to quantify it.
Knowledge of particle size is considered to be essential in most powder processing applications. This has led to the development of several methods for measuring particle size. Special emphasis is placed on the ability to analyze bulk powders.
A wide array of techniques for measuring particle size is commercially available. Most are designed to analyze dispersed particles [2]. Sieving is well suited for bulk powders and is recognized as simple yet time consuming for the analysis of particle blends [3]. Laser diffraction has been used extensively to measure particle size [4-6]. By essentially dispersing the powder in a fluid, a laser diffraction device can effectively average the various dimensions as the particles flow randomly through the light beam. A number of other methods, such as near-infrared spectroscopy (NIRS) [7,8], acoustic spectroscopy [1,9], focused-beam reflectance measurement (FBRM) [9,10] and dynamic light scattering [11] have also successfully been used to measure particle size. Many of these methods are, however, not intended for the rapid and noninvasive analysis of bulk powders as they require individual particles to be dispersed (i.e. in a liquid or gas) prior to analysis.
Microscopy can directly measure the size and deduce the distribution of the particles. It is often considered as a counterpart to sieving when determining particle size; while the former provides number average estimation, the latter imparts weight-average estimation. These methods typically rely on identifying individual particles within the powder. This may not always be possible due to issues including particle proximity, varying surface height, acquisition parameters or insufficient spatial resolution. In these cases, it may be difficult or impossible to reliably identify the particles. In any case, it is of the utmost importance to avoid selection biases (e.g. only selecting larger particles) when performing these analyses.
Different statistical image-based methods have been proposed to analyze particle size without explicitly identifying individual objects. Among these, image texture characterization, based on 2-dimensional (2-D) multivariate wavelet texture analysis (WTA), has been found to be helpful in a variety of applications including work by Calderon De Anda et al. [13] on particle shape monitoring in batch crystallizers, by Gosselin et al. [14] on the mixing dynamics of powder blends in a rotating drum and by Garcia-Munoz and Carmody [15] on the differentiation of pharmaceutical blends. A number of studies have revealed that approaches based on WTA are more efficient than traditional methods rooted in second-order statistics that only analyze texture at a single resolution [16-18].
Objectives
Most methods of determining the particle size of powders are designed for off-line use [12]. The need for a fast, non-intrusive and inexpensive particle sizing tool suitable for the production line was the key reason for the development of an image-based system. Specifically, the goal of our experiments is to infer the average particle size of bulk powders by image analysis. To achieve this objective, 2-D discrete wavelet transform, a state-of-theart method used in texture analysis, will be undertaken in conjunction with chemometric modelling. Rather than identifying individual particle characteristics, the method relies on textural features (i.e. variations in intensity) for bulk powder characterization, thus reducing analysis time and sampling bias. In essence, the target is to develop a comparative tool which can easily, rapidly and efficiently give information which could lead to 1) higher process understanding, and 2) rapid decision making protocols in process engineering.
WTA for Extracting Image Features
WTA is typically suited in applications where the data contain both large and small scales of variation, such as seasonal and daily differences. In these cases, it is capable of isolating the former from the latter. In this study, small particle sizes will typically have a strong high-frequency response whereas large particle sizes will have a strong low-frequency response. Two types of WTA coefficients characterize the signal: detail coefficients (dj,l) portray the match between the wavelet and the original signal at a scale (j) and position (l) while approximation coefficients (aj,l) correspond to the remaining information after extraction of features by detail coefficients. This rougher representation of the signal is then the basis for dj+1,l coefficients. The values of these coefficients are maximized when the frequency of the dilated wavelet matches that of the signal. Analysis of a 2-D image, rather than a 1-D signal, can be accomplished through the proper combination of horizontal and vertical wavelets and their corresponding scaling functions. Essentially, it is an extension of the 1-D algorithm discussed earlier in that it converts a low-level input signal (here a gray-scale image Aj-1) into higher-level detail signals (horizontal, vertical and diagonal detail images DH,j, DV,j and DD,j) plus a residual approximation signal (approximation image Aj). The reader if referred to Burke Hubbard [19] for more information on the subject.
Experimental
Powder Size Distribution
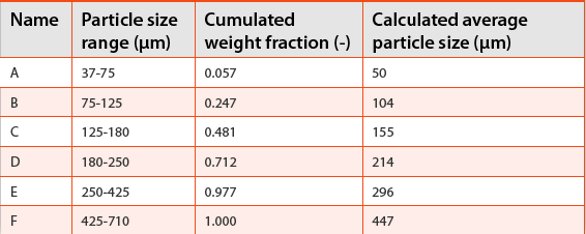
Experimental work was carried out with commercial calcium carbonate powder. The powder was sieved and found to range from 37 to 710 μm. The objective of our study was to infer particle size by weight of bulk powder blends. To reach this goal, calcium carbonate was sieved into 6 fractions (Table 1) and weighed to calculate the relative proportion of each fraction. The cumulated weight fraction of the powder samples was first computed and then fitted by cumulative normal probability distribution. This was achieved by interpreting the weight fraction of the powder in each particle size range to that of the area of a portion of normal probability function. The results indicate that the original powder has a weight-average particle size of 201 μm and a standard deviation of 90 μm.
Table 1. Particle size of 6 powder fractions (A-F) sieved from the original powder blend (37-710 μm)
Micrographs of the powders (Figure 1) were used to determine the shape of the calcium carbonate powders. Images show that size A particles (37-75 μm) are spherical, size D particles (180-250 μm) are small agglomerates of distinct particles and size F particles (425-710 μm) are large agglomerates of relatively indistinct particles. While the notion of size in such complex situations may be debatable, sieve sizing values were used as a basis for the wavelet texture analysis and chemometric modelling. Although this could be considered to be an important source of error in deterministic modeling/quantification, in statistical imaging methods it is not an issue.
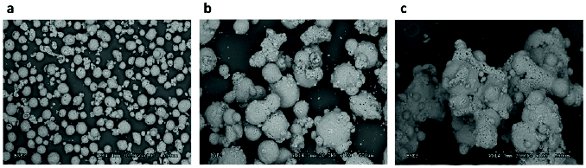 Figure 1. Scanning electron micrographs of the calcium carbonate powder of 3 of the 6 sieved fractions: (a) 37-75 μm, (b) 180-250 μm and (c) 425-710 μm.
Imaging Unit
Particles were captured with a Basler Pilot camera at a working distance of 30 cm and a 89×75-mm field of view at a spatial resolution of 36 μm. Images were later cropped, enhanced and converted to 8-bit greyscale by custom software written in Matlab R14. While preliminary tests showed that even the smallest particles could be detected on a black background, the resolution is insufficient to quantify either the size or shape of all but the very largest particles present. However, working with bulk powders shows that no individual particles can be distinguished in the images. Such a situation is often encountered industrially where high production rates may be at odds with camera integration time and spatial resolution.
Sample Types
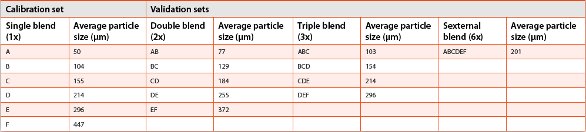
Raw material was sieved and separated into 6 different distributions (A - F). These distributions (single blends in Table 2) form the calibration set. To test the model, 3 validation sets were created. The first validation set was obtained by combining 2 consecutive single blends (double blends in Table 2). The second validation set was created with 3 consecutive single blends (triple blends in Table 2). The third validation set was created with the original powder distribution, that is to say, all 6 single blends (A - F) were mixed according to their original weight proportions. Once mixed, the samples to be imaged were prepared by pouring powder into a cylindrical sample cup and levelling the surface. Twenty samples of each powder blend were prepared and imaged.
Table 2. Average particle size of single (1x), double (2x), triple (3x) and sexternal (6x) powder blends.
Results and discussion
Particle Size Information Captured by WTA
WTA was performed on images with bior3.7, a biorthogonal wavelet available in Matlab Wavelet Toolbox. As image resolution was relatively high (the image field of view was cropped to 1800×1400 pixels) and textural features of the powders ranged widely in size (average particle size 50 to 447 μm), 7-level WTA decomposition was executed on the images. With an original spatial resolution of 36 μm, the wavelet decomposition coefficient images (DH,j, DV,j and DD,j for j = 1:7) have respective spatial resolution of 71, 140, 270, 507, 897, 1471 and 2161 μm. Working with isotropic powder blends, only the horizontal DH,j coefficients were used in this study. However, DV,j and DD,j coefficient images may be useful when working with moving powders (i.e. visible fl ow patterns) or particles with large aspect ratios (e.g. needles). As noted, WTA does not directly measure particle size but local variations in pixel color intensity. In the case of a single-color powder blend, these local diff erences may be linked to particle size whereas in the case of multi-color blends such variations may be related to composition.
To infer mean particle size from the images, it is necessary to quantify image texture. A number of scalar textural descriptors have been proposed for measuring the texture of an image, the most common of these descriptors are often referred to as Haralick features [20].
Among them, matrix energy (one of the most common metrics) was used throughout this work as the use of other descriptors did not significantly improve results. Energy (Hj) of the horizontal detail coefficient matrices (DH,j) were calculated using the Frobenius norm of the coefficient matrix (DH,j) at decomposition level j:
Figure 2 illustrates the relationship between the energy of wavelet detail coefficients (Hj) and mean particle size. Lower WTA levels (1 and 2) increase rapidly and stabilize near 150 μm, making them practical for distinguishing between the smallest particle sizes but incapable of discriminating between larger particle sizes. On the other hand, higher levels (6 and 7) do not distinguish between particle sizes below 150 μm.
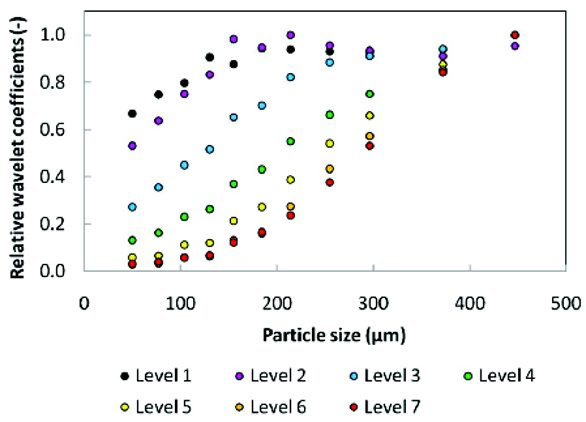 Figure 2. Wavelet coefficients for diff erent particle sizes.
Latent variable regression results
The objective of this work was to estimate the particle size of bulk powders by image analysis. It was achieved by first quantifying WTA detail coefficients (Hj) at 7 levels of scrutiny, and then building regression models between these coefficients and known particle sizes (obtained by sieving). The experimental design generated 2 datasets: a calibration set (X1 and y1) and a validation set (X2 and y2). The calibration set was created by compiling data from single blends (1x). It was comprised of X1 with WTA detail coefficients (Hj) at 7 levels of scrutiny for each of the single (1x) particle sizes and corresponding response vector y1 containing mean particle sizes of the powder blends. The validation set was created by compiling data from double, triple and sextuple blends (2x, 3x and 6x). It was comprised of X2 WTA detail coefficients and corresponding response vector y2.
Inspection of wavelet coefficients disclosed that the 7 decomposition levels are highly correlated. This is clearly visible in Figure 2 in that all Hj values increase with particle size. For this reason, a latent variable projection to latent structures (PLS) regression method was chosen. After centering and scaling the data to unit variance, a PLS model was built between X1 and y1. The first 2 principal components (PC) were found to be significant by random-subset cross-validation. Combined, the 2 first components captured 98.8% of X-block variance and 99.2% of Y-block variance within the calibration set. The PLS regression model was then validated both through internal cross-validation between X1 and y1 as well as external validation between X2 and y2.
Careful observation of the score plots and loading plots can provide some interpretation of the latent variable space. Loadings provide a view of inter-variable relations (i.e. variable similarities). In this case, the 1st principal component (PC1) captures the correlation between all wavelet levels whereas the 2nd principal component (PC2) captures the diff erence between higher and lower wavelet levels (Figure 3a). With these components, the score plot represents a projection of the samples onto the subspace created by loadings (Figure 3b). Mirroring the loading plot, the 1st component of the score plot (t1) was strongly correlated with particle size whereas t2 was positive for both the smallest and largest particles. Based on this finding, it is believed that the 1st component provides a rough approximation of particle size while the 2nd component fine tunes this approximation by explaining the relative deviation from the population’s mean. It is important to note that the data were centered prior to modelling, which, in turn, centered data points in the score plot. For this reason, the 6x validation set, comprising the entire powder distribution, was located at the center of the score plot.
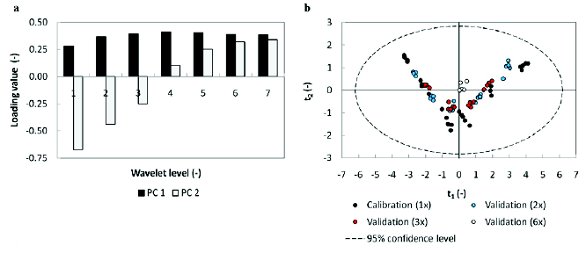 Figure 3. PLS analysis illustrating (a) loadings and (b) score plot.
Model performance is illustrated in Figure 4 in which predicted particle size is compared to that of measured particle size. As expected, within-sample variation (diff erences between similar powder samples) was smaller than between-sample variation. Furthermore, precision of the method appeared to be constant for all particle sizes included in the study.
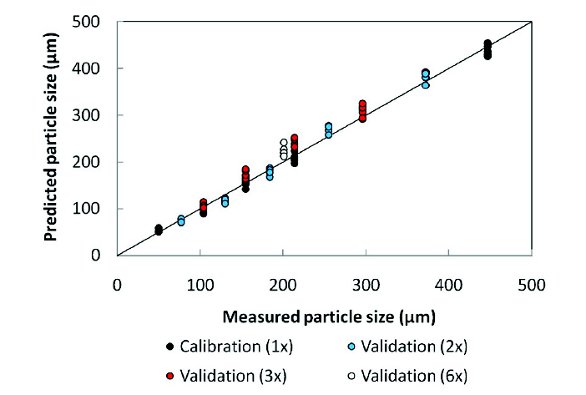 Figure 4. Particle size prediction with a 7-level WTA PLS model.
Performance of the model was quantified by root mean squared errors (RMSE) of the datasets. These terms are usually referred to as RMSEC (i.e. in calibration), RMSECV (i.e. in cross-validation) and RMSEP (i.e. in prediction), calculated according to Equation 11. Model performance was also quantified according to the coefficient of determination (R2) as well as bias of the model. Performance indicators of the PLS model are summarized in Table 3.
Table 3. PLS model performance between wavelet levels 1-7 and particle size
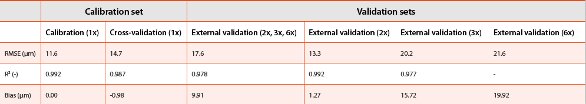
Let us assess these statistics by first considering the calibration (1x), cross-validation (1x) and the combined external validation (2x, 3x and 6x) results. According to these data, all 3 RMSE values are low (below 17.6 μm) in comparison to the particle size range considered in this study (2.5% of the 710 μm range), whereas both the R2 and bias results confirm the RMSE data in that variance explained by the model remains very high for all 3 datasets.
The external validation results were broken down into 3 distinct datasets: 2x blends, 3x blends and 6x blends, as discussed in Table 2. A clear data trend appeared upon breaking down external validation into these sets. Both the RMSE and bias values obviously increase between the 1x, 2x, 3x and 6x external validation datasets. As mentioned, validation blends were produced by mixing 2, 3 or 6 single blends together to broaden the powder distributions. It seems that this broadening of distributions has a direct impact on the capacity of the model to infer average particle size from the surface of sample blends. The increased prediction bias and RMSE of the external validation sets may be caused by particle segregation within broader particle size ranges. Specifically, sample handling may have made the smaller particles settle below the surface, leaving a relative overabundance of larger particles in the images.
Conclusion
An imaging method based on 2-D multivariate WTA methodology was developed as a scalable powder sizing tool capable of characterizing bulk powder blends. Rather than identify individual particle characteristics, the method relies on textural features (e.g., variations in intensity) to distinguish bulk powder characteristics, thus reducing analysis time and sampling bias. This may especially be useful to monitor industrial applications where high production rates make it difficult or impossible to reliably identify individual particles.
The results show that the mean particle size of single-colored bulk powder blends can be inferred from prepared samples. Working with powder blends ranging in size between 37 and 710 μm, error on the average predicted particle size of the blends varied between 11.6 and 17.6 μm (RMSE) for the calibration and external validation datasets, respectively. These experiments demonstrate that WTA, coupled with chemometric modelling, can be a useful tool to quantify particle size. However, it must be stated that this method is not intended as an absolute measurement or particle size. This method has been shown to monitor average particle size, not particle size distribution, and that, as any method based on surface analysis, it cannot be used to monitor core changes beneath the surface. Moreover, special care may be required when working with needle-shaped particles presenting high aspect ratios.
Author biographies
Dr. Ryan Gosselin is an assistant professor at the Department of Chemical & Biotechnological Engineering of Université de Sherbrooke, Canada. He is a specialist in Process Engineering and in-line quality optimization through the use of multivariate data analysis and chemometrics. As a member of the Pfizer Industrial Research Chair on Process Analytical Technologies (PAT) in Pharmaceutical Engineering, his present work focuses mainly on issues relating to the production, monitoring and handling of non-reactive particulate systems.
Marc-Olivier Lacombe is a 4th year student in the Department of Chemical & Biotechnological Engineering of Université de Sherbrooke, Canada. Through the co-operative education program of the university, Marc-Olivier took part in the Pfizer Industrial Research Chair on Process Analytical Technologies (PAT) in Pharmaceutical Engineering.
Dr. Nicolas Abatzoglou is full professor and Pfizer Chair Holder at the Department of Chemical & Biotechnological Engineering of Université de Sherbrooke. He is a specialist in process engineering involving particulate systems in reactive and non-reactive environments. He is the holder of the Pfizer Industrial Research Chair on Process Analytical Technologies (PAT) in Pharmaceutical Engineering. He is co-founder of the company Enerkem Technologies Inc., a spin-off of Université de Sherbrooke in the field of energy from renewable resources. He is also the Leader of the Fuel Preparation Theme in SOFC Canada Network operated with a funding of 5M$ over 5 years (2008-2013).
References
- Horiba: A guidebook to particle size analysis, Irvine, CA, USA, 1-30 (2010)
- Tinke, A.P., Govoreanu, R., Weuts, I., Vanhoutte, K. De Smaele, D.: A review of underlying fundamentals in a wet dispersion size analysis of powders, Powder Technol. 196, 102- 114 (2009)
- Laitinen, N., Antikainen, O., Yliruusi, J.: Does a powder surface contain all necessary information for particle size distribution analysis?, Eur. J. Pharm. Sci. 17, 217-227 (2002)
- Andrès, C., Réginault, P., Rochat, M.H., Chaillot, B., Pourcelot, Y.: Particle-size distribution of a powder: comparison of three analytical techniques, Int. J. Pharm. 144, 141-146 (1996)
- Hackley, V.A., Lum, L.S., Gintautas, V., Ferraris, C.F.: Particle size analysis by laser diff raction spectrometry: application to cementitious powders, NIST, Gaithersburg, MD, USA (2004)
- Tinke, A.P., Carnicer, A., Govoreanu, R., Scheltjens, G., Lauwerysen, L., Mertens, N., Vanhoutte, N., Brewster, M.E.: Particle shape and orientation in laser diff raction and static image analysis size distribution analysis of micrometer sized rectangular particles, Powder Technol. 186, 154- 167 (2008)
- Blanco, M., Peguero, A.: An expeditious method for determining particle size distribution by near infrared spectroscopy: comparison of PLS2 and ANN models, Talanta 77, 647-651 (2008)
- Grohganz, H.: Near-infrared (NIR) spectroscopy – a versatile tool for pharmaceutical research and production, Eur. Pharm. Review, April (2011)
- Sarkar, D., Doan, X.T., Ying, Z., Srinivasan, R.: In situ particle size estimation for crystallization processes by multivariate image analysis, Chem. Eng. Sci. 64, 9-19 (2009)
- Kempkes, M., Eggers, J., Mazzotti, M.: Measurement of particle size and shape by FBRM and in situ microscopy, Chem. Eng. Sci. 63, 4656-4675 (2008)
- ISO: Particle size analysis - Dynamic light scattering, 22412 (2008)
- Dahl, C.K., Esbensen, K.H.: Image analytical determination of particle size distribution characteristics of natural and industrial bulk aggregates, Chemometr. Intell. Lab. 89, 9-25 (2007)
- Calderon De Anda, J., Wang, X.Z., Roberts, K.J.: Multi-scale segmentation image analysis for the in-process monitoring of particle shape with batch crystallisers, Chem. Eng. Sci. 60, 1053- 1065 (2005)
- Gosselin, R., Duchesne, C., Rodrigue, D.: On the characterization of polymer powders mixing dynamics by texture analysis, Powder Technol. 183, 177-188 (2008)
- Garcia-Munoz, S., Carmody, A.: Multivariate wavelet texture analysis for pharmaceutical solid product characterization, Int. J. Pharm. 398, 97-106 (2010)
- Fan, G., Xia, X.: Wavelet-based texture analysis and synthesis using hidden Markov models, IEEE Trans. Circuits Sys. I. Fundam. Theory Appl. 50, 106-120 (2003)
- Bharati, M., Liu, J., MacGregor, J.F.: Image texture analysis: methods and comparisons, Chemometri. Intell. Lab. 72, 57-71 (2004)
- Liu, J.J., MacGregor, J.F.: Estimation and monitoring of product aesthetics: application to manufacturing of “engineered stone” countertops, Mach. Vision Appl. 16, 374-383 (2006)
- Burke Hubbard, B.: The world according to wavelets. The story of a mathematical technique in the making, A.K. Peters, USA (1998)
- Haralick, R.M.: Statistical and structural approaches to texture, Proc. IEEE 67, 786-804 (1979)