Introduction
Polymorph and crystal form control is an essential part of development of active pharmaceutical ingredients (API) [1]. Processing steps such as milling for API particle size reduction or those involved in the solid dosage form processing have potential to alter the input crystal form and this is often referred to as Process Induced Transformation (PIT). The impact and mechanisms of processing stress on phase transformation have been well reviewed and examples are provided [2-5]. Although basic physical characterization techniques can be successfully applied at the API level for form assessment, detection of low levels of different crystal forms within a dosage form on a routine or release basis can require significant effort and can be challenging because of detection limits and specificity [1]. Discovery of a drug substance solid phase issue late in the development of a tablet dosage form can require implementation of resource and time consuming method development, validation and testing. Without adequate understanding of where and how API transformation occurs in the dosage form process, key clinical or commercial batches may fail release testing. Consequently, it is important to conclusively and systematically establish solid form integrity, from API formation through dosage form manufacture. The extended analysis presented here, although not a regulatory requirement, was conducted to provide a thorough understanding of the PIT related factors that had the potential to impact axitinib form integrity.
Development of axitinib (CAS Registry Number 319460-85-0) posed several issues relating to solid form control as an API and drug product. First, axitinib had a complex isolation history and over 70 forms were discovered [6]. The final development form was discovered after clinical trials were conducted with other forms. Second, it was a Biopharmaceutical Classification System (BCS) II compound (thermodynamic aqueous solubility of 0.2 μg/ml) and required particle size reduction to achieve adequate dissolution rate for maximizing exposure. Consequently, the formation of polymorph mixtures, form alteration or contamination due to PIT had implications for exposure as well as stability or manufacturability.
This article focuses on the assessment and analytical studies that were conducted on key API and drug product samples to build a framework establishing continuity of API form throughout the dosage manufacture and if needed, form the scientific narrative for future supporting regulatory documentation. In the course of this work, various modalities of Raman spectroscopy proved particularly useful in distinguishing API solid forms as well as in semi-quantitative differentiation of axitinib forms in tablets. Development of a consistent rationale for form integrity requires a detailed understanding of the solid forms, their potential transformation pathways and isolation process and thermodynamic and kinetic relationships. A variety of complementary physical characterization methods including X-ray powder diffraction (XRPD), differential scanning calorimetry (DSC) and 13C Cross-Polarized, Magic Angle Spinning (CP-MAS) Solid State Nuclear Magnetic Resonance (ssNMR) were also applied both qualitatively and quantitatively to both API and drug product (tablets). The use of orthogonal techniques allows for independent corroboration of qualitative sensitivity limits when application of standard two-state mixtures may not represent the analytical response of the processed material.
The assessment of form integrity was achieved based on a thorough understanding of solid form relationships which were established during the rigorous development of the isolation and form control process [7] and a breakdown of solid dosage form manufacturing process relative to potential stresses [3]. We start by identifying the relevant forms of the API and potential phase transformation pathways, establish the suitability of various characterization techniques for detection of alternate crystal forms in the API and drug product, conduct verifi cation of API form in in-process and fi nal samples in the tablet manufacturing process, and fi nally discuss the nature and assess the impact of potential amorphous formation. For additional background and application information on Fourier Transform Raman Spectroscopy (FT-Raman) for solid form analysis, the reader is directed to the literature [8-10].
Determination of relevant Forms and phase transformation pathways
Despite axitinib’s proclivity toward multiple forms, many of them are solvates with solvents that are not utilized in the drug substance isolation or in the processing of the drug product and therefore do not have to be considered since they cannot be formed from the isolated drug substance or drug product manufacturing process. Based on the solvent systems and design space for the isolation, the only solvate that needed to be considered as a potential residual form from isolation is Form XLVI, an NMP Solvate.
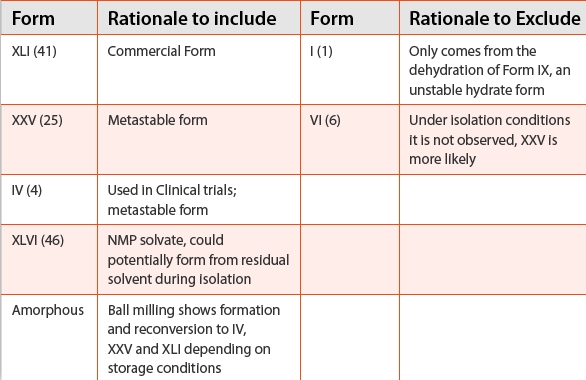
Table 1 outlines the relevant forms and the rationale for inclusion in this analysis. The remaining forms that required consideration for potential transformation were the anhydrate Forms XXV and IV and a hydrate form. Late stage development milling studies also indicated the possibility that the amorphous form should also be included in the assessment. In the development of the isolation process it was established that Form VI was not observed at any point. Form I was only accessible through dehydration of Form IX (unstable hydrate) which does not form when Form XLI is slurried with water. Form XLVI (NMP solvate) is accessible through the current crystallization process. Although a release test was in place to ensure solid state purity at the time of isolation, the PIT analysis included the potential presence of this form.
Table 1. Outline of the relevant forms and the rationale for inclusion in PIT analysis.
The thermodynamic stability relationship among the anhydrous forms was determined based on solubility, DSC, and crystallographic data and was identifi ed as follows (lowest to higher free energy):
Form XLI is the lowest energy form; it had the highest ΔHf, highest Tm and lowest solubility of the anhydrous forms. It is monotropic with respect to all other anhydrous forms and thus is the lowest energy form over all temperatures. Consequently, if any transformation into a higher energy phase occurs, there will be a thermodynamic driving force to eventually recrystallize as Form XLI.
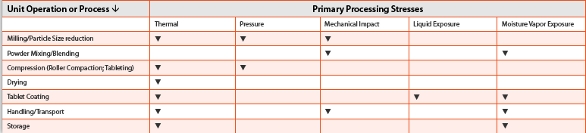
Evaluation of PIT requires a careful analysis of the process fl ow diagram for the unit operations used in producing the dosage form. The formulation process for axitinib utilizes dry granulation with blendmill- blend steps, standard single layer tablet compression and aqueous film coating. The major processing steps where phase transformation has the potential to occur for axitinib are listed (Table 2) and the nature of the mechanisms governing these types of phase transformations has been described [5, 11]. Based on this information, aspects of the unit operations have been examined relative to their potential to induce phase transformation in the drug substance. Because of its low solubility, particle size for this API must be controlled to achieve appropriate dissolution characteristics and to optimize its absorption profi le. Consequently, particle size reduction of the initially isolated axitinib crystals was necessary. Because milling can induce stressed states in organic molecular crystals [5] that result in higher energy states with higher solubility, as well as potential for subsequent transformation to other for forms, the impact of the commercial milling process on the compound was evaluated. The potential for PIT due to milling was assessed across a particle size range encompassing a robust operating space for milling.
Table 2. Processing stresses for axitinib that could impact API form [2, 3].
Assessment of api polymorphic Form transformation potential
Because Form XLI is the lowest energy form and monotropic with respect to the others, there is no possible direct crystal-to-crystal phase transformation available purely as a thermally-induced transformation. This was further supported by VT-XRPD which indicated no transformation prior to the melt of axitinib Form XLI of milled drug substance. Due to the variety of mechanisms of transformation available through other stressed states it was important to examine crystal form transformation utilizing multiple techniques [2, 3, 11].
To assess whether the combined impact of thermal and mechanical stress during milling [12] aff ected the form of the API, physical characterization data for unmilled drug substance was compared to that of milled material from a regulatory stability lot that was milled using the proposed commercial milling process. Several techniques were applied to ensure that a differentiable signal was obtained because it was not known a priori which techniques would have appropriate sensitivity for the different forms relative to Form XLI. FT-Raman, DSC, XRPD, and ssNMR were applied qualitatively to establish that milling the drug substance caused no change in the polymorphic form. Physical mixtures of Form XLI and “contaminant crystal forms” were prepared by weight, mixed and analyzed with each of the techniques.
Detection of axitinib Forms
Crystal form spiked physical mixtures were gravimetrically prepared at 1, 2 and 5% levels and were measured by FT-Raman using standard experimental parameters. Note that the estimates of polymorph level are qualitative and were based on consideration of the raw data and no pre-processing was performed. In most cases, lower detection levels could likely be achieved by utilizing multivariate techniques and additional calibration samples. However, a visual evaluation comparing spiked samples was sufficient in this case to determine whether milling induced any potential form changes.
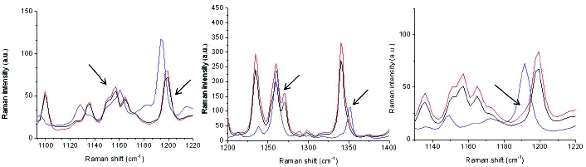 Figure 1. FT-Raman spectral overlays of 2% Form IV (left), 2% Form XXV (middle) and 2% Form XLVI (right spiked into Form XLI. The arrows denote the regions in which the spectra demonstrate the presence of these contaminant forms. The blue spectra are references of the contaminant forms, while the black and red spectra are Form XLI and 2% spiked samples, respectively.
Form XXV exhibits a Raman spectrum which is characteristically different than Form XLI. One peak can be used to observe the presence of 2% Form XXV (Figure 1). The Raman spectrum for Form IV is very similar to Form XLI, but there is one peak in the spectrum that broadens if Form IV is present (Figure 1). For Form XLVI, there is one peak (Figure 1) that can be used to identify its presence down to ~2%. Examination of an overlay (Figure 2) of regulatory stability batch material before and after milling indicated no change in the crystal form.
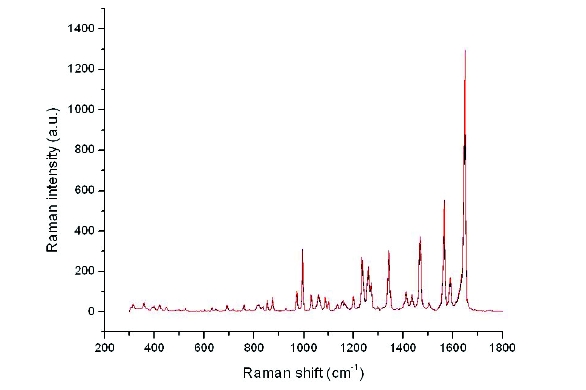 Figure 2. FT-Raman spectral overlays of Form XLI before (red) and after (black) milling.
The same blends utilized in the FT-Raman assessment were also utilized for DSC measurements to determine if this technique could be used to probe low levels of crystalline contaminant forms. DSC also was capable of distinguishing small amounts (~1%) of Forms XLVI, IV or XXV (Figure 3).
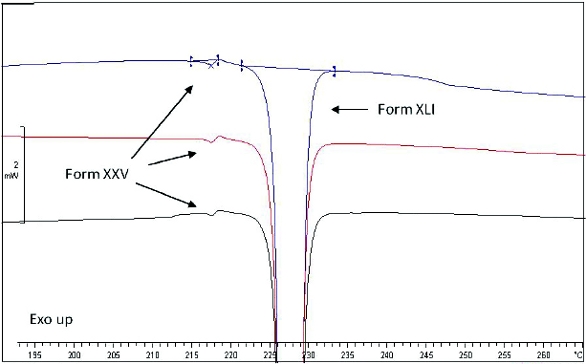 Figure 3. Replicate DSC scans (10 oC/min) of 1% Form XXV in Form XLI, demonstrating that this level of polymorphic form is detectable with this technique.
Solid state NMR was performed on both unmilled and milled ICH drug substance. The ssNMR spectra of these samples were identical within ±0.2 ppm to the reference standard and indicate that the crystal form is conserved throughout the milling process. Axitinib Form IV, Form XXV and Form XLVI were not detected in the ssNMR spectra after milling, where qualitatively determined limits of detection from spiked Form XLI samples were 2% for Form IV, 5% for Form XXV and 5% for Form XLVI, respectively.
To determine whether XRPD was capable of detecting low levels of the key crystal forms in the presence of Form XLI, the spiked samples utilized with other techniques were analyzed by XRPD. Forms XXV and IV were differentiable at the 5% level with several unique peaks becoming visible above the baseline for Form XLI (Figure 4, Form XXV). Alternatively, Form XLVI was detectable at a level of 1% given the presence of several unique peaks (Figure 5). Finally, milled drug substance was compared to the unique peaks indicated in the previous three comparisons for spiked standards for Forms IV, XXV and XLVI. The milled drug substance showed no detectable change indicating the presence of any alternate crystalline form, either residual or as a result of milling.
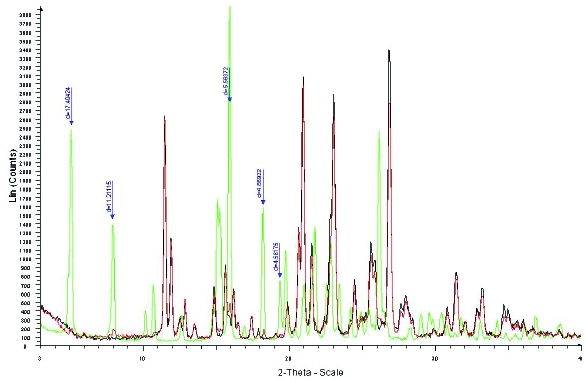 Figure 4. XRPD overlay of Form XXV (green), Form XLI (black) and 5% Form XXV mixed with Form XLI (red). Arrows indicate individual peaks of Form XXV that can be identified at the 5% level.
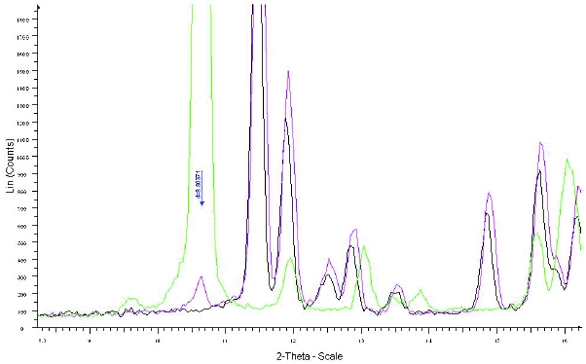 Figure 5. XRPD overlay of Form XLVI (green), Form XLI (black) and 1% Form XLVI (pink) mixed with Form XLI. The arrow indicates the unique peak of Form XLVI that can help identification at the 1% level.
Although initial milling studies in early development did not indicate a detectable change in form or the induction of amorphous material, different milling techniques were implemented to optimize the particle size distribution during scale up of API processing. Therefore, it was important to examine the API for the presence of amorphous content as a result of milling at large scale using the expected commercial milling process or as a result of dosage form processing.
Detection of low levels of amorphous API in the presence of crystalline material can be a challenging analytical eff ort and different techniques may have varying sensitivities [13]. To better understand the sensitivity of each of the techniques to the amorphous form, a set of gravimetric standards was prepared with Form XLI and cryomilled amorphous material at 1, 2, 5 and 10% levels and measured by FT-Raman, DSC, XRPD and ssNMR to determine qualitative sensitivity limits. These data were then used to closely examine the various milled samples and qualitatively determine if amorphous content was present. Using FTRaman, the qualitative means used to assess for amorphous content was a tailing of the main peak at ~1646 cm-1 to lower wavenumbers. A milled sample subjected to milling stress outside the commercial design space (sample TM-1) contained a slight tailing, indicating the likely presence of amorphous material (Figure 6).
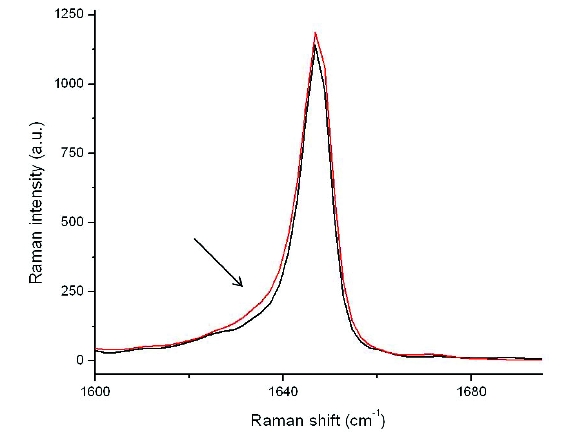 Figure 6. FT-Raman spectra overlay of a regulatory batch sample (black) and sample TM-1 (red). The arrow denotes the tailing effect which is seen when amorphous material is present.
To more precisely differentiate this, a partial least squares (PLS) model of the FT-Raman data was developed based on the set of physical mixture standards prepared at levels of 0, 1, 2, 5, and 10% amorphous. The model utilized a data pre-treatment with area normalization over the whole spectral region (to correct for intensity differences), and a 25-point Savitsky-Golay smoothing applied to the 2nd derivative of the spectra. The 2-factor PLS model was restricted to the region between 1620-1680 cm-1. The validation plot for the model had an R2 of 0.998.
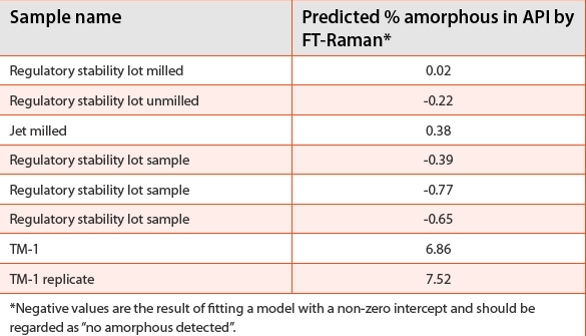
The predicted values of amorphous content based on the model show that sample TM-1 contains amorphous content at ~7.5% (Table 3). This is consistent with what was qualitatively seen with other techniques. Additional regulatory stability lot milled samples as well as unmilled and jet milled lot (Table 3) do not show evidence of amorphous content.
Table 3. Predicted %amorphous content utilizing a 2-factor PLS model on FT-Raman data collected on regulatory stability lot samples, a jet milled sample and sample TM-1.
DSC was useful for initially screening various lots for any signature of bulk amorphous content. The TM-1 sample shows a minor endotherm in the 110-150ºC region which was indicative of some complex Tg/ recrystallization of amorphous content (Figure 7), but the technique was not explored quantitatively. Preliminary analysis with ssNMR indicated a qualitative level of detection of 15% amorphous-based on spectral simulations. In addition, the long relaxation time of crystalline axitinib resulted in prohibitively long acquisition times. The combination of these two factors made the use of ssNMR for amorphous quantifi cation too difficult to employ and of limited value.
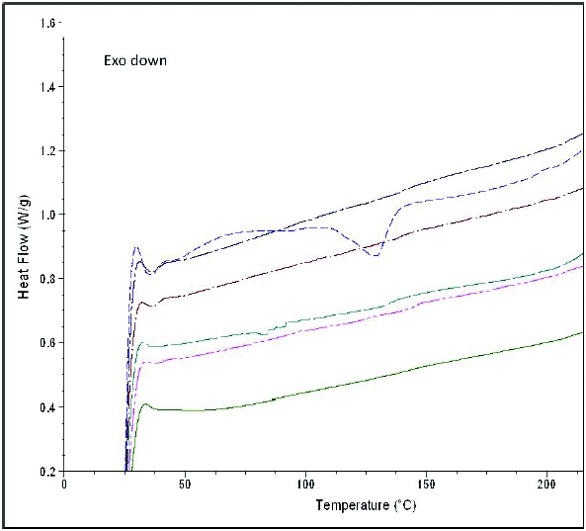 Figure 7. DSC Scans for several regulatory stability lots at 40oC/min expanding the area prior to the melt. Sample TM-1 from milling trials is included for comparison (blue dash).
As an additional means of estimating the presence of amorphous content, XRPD analysis was conducted. The total relative crystalline content of each sample was determined by subtracting the background/ amorphous component from each un-normalized diffractogram and then calculating the net area of the crystalline refl ection peaks over the entire range analyzed (3-40 º 2-θ). Analyses were conducted in triplicate and averaged with RSDs ~<5%. One drawback of this XRPD method was that amorphous scatter cannot be differentiated between bulk disorder and lattice defects; both potentially contribute to loss of crystalline intensity. The results of the XRPD analysis of the samples tested using FT-Raman were correlated with each other although the absolute values differed because the XRPD technique interrogates a different aspect of disorder than does the FT-Raman. Moisture vapor sorption was explored as an additional technique but was not sensitive to the amorphous content in the spiked amorphous samples or the TM-1 sample. Additional calorimetric methods, other than DSC and mDSC for API analysis, were not utilized in this analysis since they would not be amenable for determination of form in drug product samples.
Solid Form Verification in Drug Product Process Unit Operations
Axitinib tablets are made using a dry granulation process. To assess whether the various segments of the drug product process altered the crystalline form, process control samples generated from a development scale batch from various stages were evaluated by FT-Raman spectroscopy. This technique was utilized because of the sensitivity and specificity for differentiating the relevant crystal forms and the amorphous form even at low levels in the drug product. In preliminary experiments performed on crystal form spiked tablets, FT-Raman was qualitatively able to resolve down to ~10% level for the amorphous form and ~5% for Forms XXV and IV. Note that this was a qualitative limit based on visual interpolation; lower levels would be accessible with multivariate techniques and more extensive calibration sets.
The in-process control samples from several stages for the formulation process were analyzed by FT-Raman and the results referenced back to the drug substance used in that batch. The input drug substance was fi rst compared to a regulatory stability milled lot to establish drug substance consistency. Next, the API signal in the fi nal blend was compared to the input drug substance. Intensity differences were noted because of the low drug load and the contribution of the excipients to scattering; however, there was consistency between drug substance peaks and those in the final blend. No intensity normalization was used in comparing spectra. The averaged spectra overlaid well and the absence of extraneous peaks indicated that the crystalline Form XLI remained consistent throughout the processing steps. Finally, individual spectra from intact tablet cores were compared to the spectrum of the roller compacted ribbons and shown to be identical. An overlay of the spectra of all the in-process samples collected during unit operations are shown in Figure 8. Overall, these results indicate that the formulation process does not alter the input crystal form of the API at an approximate concentration level of 5% for Forms XXV and IV and 10% for the amorphous form.
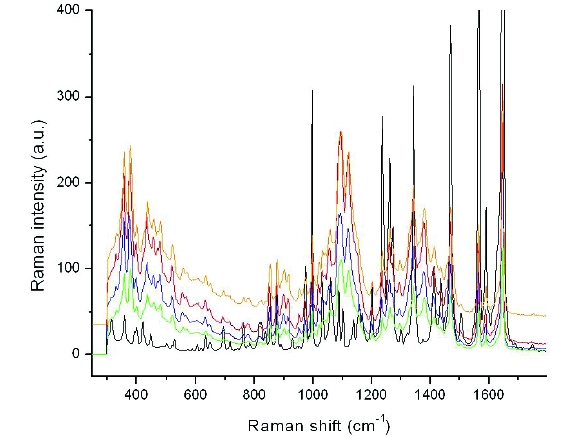 Figure 8. FT-Raman spectral overlay of input drug substance (black) with the lubed blend (red), lubed granulation (green), roller compaction ribbons (blue) and final tablets (orange).
To establish that the compaction process did not alter axitinib Form XLI, a study was performed on drug substance compacts containing no excipients. A milled sample of drug substance was compressed into ~0.5 g rectangular compacts using a tri-axial press with controlled decompression. Compacts (n=2) were prepared at 0.85 and 0.89 solid fraction, which is representative of the solid fraction range of the fi nal dosage form. FT-Raman spectra of the compacts at the two different solid fractions were overlaid with the input drug substance and no signifi cant differences were observed. There are some differences in intensity, but the overall peak positions are identical. There is some slight baseline shifting below ~1000 cm-1, which is likely due to local heating eff ects on the compacts, which were not rotated during sampling. The compacts showed no evidence of any other crystal form or amorphous conversion because there was no tailing of the peak at ~1646 cm-1, (indicative of amorphous material), nor was there spectral evidence of any peaks belonging to Forms IV or XXV. In addition, because the formulation has a loading of ~5% drug substance, the shear forces on the drug substance particles will be dissipated by the presence of the excipients, ultimately limiting any additional impact of compression.
The film coating process can produce several stresses on drug substance including exposure to elevated temperature, solution phase contact, and relative humidity (or drying condition) exposure. Form XLI was shown to be stable to elevated temperature up through the melting point which is considerably below the temperatures encountered during film coating, which are typically in the range of <60oC at the tablet bed [14]. Because Form XLI has the lowest solubility of the anhydrous crystal forms, no interconversions are expected due to dissolution and re-precipitation of the drug substance. The solubility of the drug substance in aqueous solution is extremely low (0.2 μg/ml), consequently, very little drug substance from the surface of the tablet can be dissolved in the time bulk liquid is on the surface of the tablet.
To further ensure that the presence of the film coating polymer did not have an influence on potential recrystallization, a slurry conversion study was performed in water with constituents of the film coating system that could affect recrystallization. An in-situ Raman probe was used to monitor for any polymorphic conversions. A solution of the polymer and plasticizers that comprised the film coating was used to avoid interference by additional soluble and insoluble components present in the colored coating. A slurry of the drug substance in the coating solution was monitored using the Raman probe over several hours. Two spectral regions were monitored that were indicative of any polymorphic transformation, 1248-1280 cm-1 and 1650 cm-1. An overlay of the spectra obtained at various times shows that there was no change in solid form and intensity fluctuations are only due to sample presentation effects. Comparison of the final slurry spectrum to the initial and that of the original solid indicates that there was no detectable change in the polymorphic form over a period of five hours at elevated temperature (40ºC). Therefore, crystal form alteration due to the coating process can be excluded from occurring.
Investigation of the Nature and Potential Impact of Amorphous Formation
The induction of disorder by milling of organic molecular crystals is common but is not definitively understood. Recent findings in the literature indicate that both the mechanistics of formation and the resultant behavior of disordered materials can be extremely complex and this complicates the previous conceptual picture of partially amorphous materials [15-19]. Having determined that disorder could be created under certain stressed milling conditions, it was important to probe the nature of the disorder further. A set of analyses focused on understanding how the disorder was created, its “location”, and characterization behavior, were conducted using Polarized Light Microscopy, Thermally Stimulated Current (TSC),Modulated DSC (mDSC), Scanning Electron Microscopy (SEM), and Solid State 1H T1 NMR Relaxation. The results from these additional experiments indicated that milling axitinib can potentially induce small levels of disorder. But the results also showed that the disorder does not behave like a bulk phase amorphous material that was obtained from melt-quenching the drug substance. Very aggressively milled axitinib manifests the greatest appearance of any detectable signal corresponding to the disordered state. However, the regulatory stability lots tested did not show similar behavior despite being milled to the same particle size. There was a general correlation among the results for Raman, XRPD and mDSC and these data corroborated the concept that the disorder produced by milling was a combination of a small portion of the material achieving the glassy state and another component related to lattice defects or other less mobile disorder. It was hypothesized that when the brittle-to-ductile transition is reached, as more energy is applied, further incorporation of lattice defects gives rise to small amounts of either surface or bulk vitreous state. The differences in these types of disorder could not readily be differentiated by FT-Raman or XRPD. In addition, the creation of “standards” is problematic because a binary physical mixture of amorphous standard and crystalline standard may not adequately represent the one-state system generated due to milling. The pursuit of routine quantification of small, variable amounts of disorder that are a natural consequence of the particle size regime required for the drug substance is not prudent because it potentially has no significant impact on drug product performance or efficacy.
It was thus important to clarify whether small levels of disorder could be easily ameliorated or have any significant impact on the drug product performance, stability, or efficacy. Thermal annealing was investigated as a potential means to ameliorate existing amorphous content. It was found that heating a sample up to 100ºC briefly could cause recrystallization of the amorphous content. However, conducting this type of annealing on large amounts of drug substance would not be a preferred process because of stability impact. The combination of relative humidity and temperature over time was examined for their impact on low levels of amorphous. Exposure of a milled sample containing amorphous content to either 50%RH at 50ºC or 75%RH at 70ºC for 7 days erased the “recrystallization peak” compared to the initial sample. Given this behavior, it was of interest to know whether this recrystallization would potentially occur in the different packaging configurations that drug product would encounter. If rapid recrystallization of any disorder/ amorphous content during drug product storage could be ascertained, then this transformation could be considered as part of a strategy for justifying that potential amorphous content was of low impact.
An analysis of the water activity in bulk packaged tablets was conducted to assess whether the amounts of water in these packaging configurations would be sufficient to achieve recrystallization of the amorphous component in the drug substance. Estimated water activity values for packaging were compared to elevated temperature and %RH conditions where recrystallization of amorphous axitinib was known to occur. The impact of moisture sorption on Tg and its effect was also considered in the analysis. The results indicated that the water activity required for recrystallization could not be achieved under the conditions of packaged tablets, either in a bulk drum or HDPE bottles at room temperature. Therefore, it was unlikely that if present, amorphous axitinib could be induced to crystallize over a short period of time.
Because disordered phases are expected to have higher dissolution rates than crystalline phases, small amounts of amorphous axitinib would dissolve faster and drug release would be expected to be faster, if differentiable at all. Furthermore, because the drug substance is already the lowest energy phase, any re-precipitation of the dissolved amorphous phase following supersaturation would necessarily be in a form of higher or equal solubility relative to Form XLI. Consequently, the dissolution rate could not be decreased below that of the crystalline Form XLI phase. To experimentally demonstrate that amorphous content did not impact dissolution, tablets were made using a compaction simulator with drug substance containing ~5-10% amorphous content. The dissolution profiles of these tablets were compared to tablets made from a drug substance regulatory stability lot of similar particle size containing no amorphous content. An F2 dissolution correlation test indicated that the dissolution profiles were identical.
To address whether amorphous content would impact drug product stability, drug product stability studies were conducted with tablets made from drug substance containing amorphous content. An accelerated drug product testing protocol was applied and data were compared to that of another drug substance lot. The overall total degradation was not discriminatory taking the %RSD into consideration. This result provided high confidence that there is no expected significant impact on stability due to drug substance disorder. Amorphous recrystallization studies had indicated that amorphous axitinib crystallizes to Form IV or XXV or XLI depending on the environmental conditions of %RH and temperature. Because these alternate forms were also known to be chemically stable and would not be present to a significant degree if recrystallization were to occur, their presence would not be expected influence chemical stability.
As a further confirmation to establish that no amorphous content or other anhydrous forms were detectable in commercial scale tablets in ongoing regulatory stability studies, Raman mapping using a statistically optimized sample routine was employed [20]. The analysis was conducted comparing time zero tablets and actual stability tablets from two storage conditions up to 36 months. Using tablets prepared as reference standards spiked with amounts of amorphous drug substance at the 2.5, 5 and 10% level, it was possible to detect down to the 2.5% level for the amorphous form. Additional tablets with 5% of either Form IV or XXV were prepared and analyzed in a similar manner. The 5% level of the contaminant forms was easily detected with Raman mapping [21] and given the ability to detect the amorphous form at 2.5%, it is likely that Forms IV and XXV could be detected at those levels as well, given that amorphous API typically scatters much less efficiently than crystalline API. No amorphous content or any of the other crystalline contaminant forms were detected in the regulatory stability tablets at time zero or up to 36 months on stability. In addition to confirming the integrity of Form XLI on stability, this analysis also set a hypothetical lower limit of detection for the amorphous form or other crystalline forms that could hypothetically go undetected in drug product for a typical commercial drug substance lot.
To establish an upper limit of potential amorphous content, tablets made using TM-1 drug substance were assessed for amorphous content using a FT-Raman method. A comparison was made using amorphous spiked 1mg tablets at 5 and 10% amorphous content. Some band broadening was observed in the 1640-1630 cm-1 region, indicative of amorphous content. Figure 9 shows that the tablet made with lot TM-1 is bounded by the 10% amorphous spiked tablet. Therefore as a qualitative estimate, assuming TM-1 represents the maximally disordered drug substance expected from an atypical process, a tablet would contain no more than 10% amorphous content.
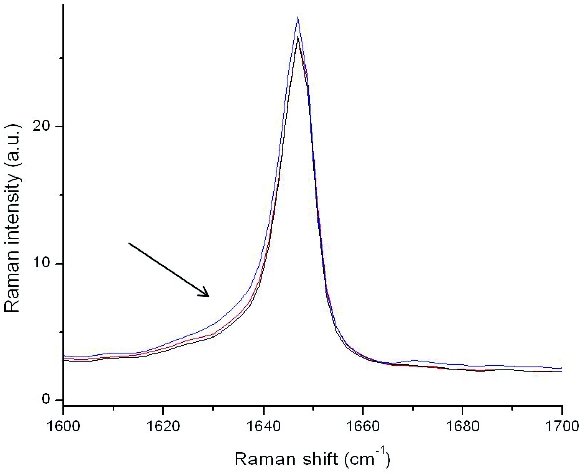 Figure 9. FT-Raman spectra overlay of the TM-1 tablet (red) with a 10% amorphous spiked tablet (blue) and a Form XLI regulatory stability tablet (black). The arrow illustrates the region of change in the Raman spectrum.
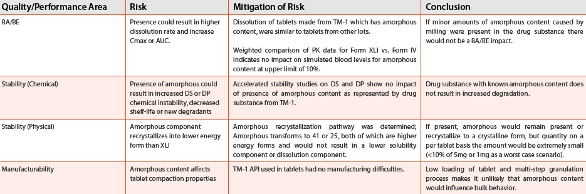
With these ranges established, further calculation of the impact of amorphous content on effi cacy was assessed using a pharmacokinetic modeling analysis. Modeling was conducted using a simulation software package, human clinical data available from studies with different forms, and solubility data obtained from rotating disk analysis and dissolution data. A higher energy polymorph (IV) was used as a surrogate for the amorphous form as a reasonable representation of fastest dissolution rate since no difference in dissolution rate was observed between form IV and the amorphous form. Clinical data was used to simulate the pharmacokinetic (PK) profi le for a dose having a proportion of crystalline and amorphous components by linear combination of the mean data at each sampling point for the respective forms. The results showed even at simulated levels of 25% amorphous, the values of the ratios of Cmax and AUC relative to pure Form XLI were well within 80-120%. From this result it could be inferred that no significant differences in plasma levels due to inclusion of the high solubility amorphous-like component and there would likely be no resultant impact on efficacy. In accordance with ICH Q6A, Table 4 summarizes the risks, rationale and mitigation steps that justify the conclusion of no impact if amorphous content were present at the levels encountered in aggressively milled drug substance. Based on this analysis there would be no justification for determination of crystallinity of milled drug substance or in drug product.
Table 4. Outline of risks and mitigation for impact of amorphous content caused by milling.
Conclusions
Raman spectroscopy was used in conjunction with other solid state characterization techniques to probe the solid form integrity of axitinib, a highly polymorphic API alone and within the drug product. Axitinib Form XLI does not undergo any crystalline solid form transitions as a result of drug product processing, as shown by FTRaman spectroscopy and corroborated by additional techniques. By systematically examining the drug product manufacturing process and any precursor stresses the API may encounter, it was possible to establish the integrity of the solid form of axitinib in the drug product. Milling axitinib under conditions outside the operational design space were shown to result in generation of minor levels of disorder/amorphous content in development lots. Additional range finding assessments showed that its presence would have negligible impact on bulk physical stability, chemical stability or the efficacy of the drug product using a drug substance lot expressing a worst case scenario. Raman spectroscopy was utilized in several modalities to assess different crystal forms and amorphous material in API and drug product to more fully understand the impact of PIT on axitinib and was highly useful in establishing the solid form integrity of the chosen polymorph.
Acknowledgements
The work included in this publication was conducted at Pfizer. The authors acknowledge their present and former colleagues at Pfizer that contributed their expertise in the development of axitinib and were critically involved in establishing the data used in this presentation: Anthony Campeta, Brian Chekal, Peter Drupa, Heather Frericks-Schmidt, Kazuko Sagawa, Ilie Saracovan, and Slobodan Sasic. Keith Horspool is also acknowledged for encouraging and supporting the PIT assessment of axitinib.
Author Biographies
Shawn Mehrens received her B.A. in Chemistry from Albion College and M.S. in Analytical Chemistry from Michigan State University. Her pharmaceutical career began with Pfizer in Ann Arbor, MI as a preformulation scientist providing early Discovery and formulation support. Her tenure at Pfizer continued with a move to Groton, CT to join the Materials Science group, where she currently holds the position of Senior Scientist. In this role, Shawn is responsible for form selection, materials characterization and understanding API form in drug product. In addition to her interest in solving solid form problems with standard techniques, she also utilizes her experience and passion for vibrational spectroscopy to augment these techniques in her group’s projects whenever possible. Paul E. Luner, Ph.D., received his B.S. in Chemistry from Syracuse University and his Ph.D. in Pharmaceutics from The University of Michigan, College of Pharmacy where he worked with Prof.
Paul E. Luner, Ph.D., received his B.S. in Chemistry from Syracuse University and his Ph.D. in Pharmaceutics from The University of Michigan, College of Pharmacy where he worked with Prof. Gordon Amidon. He is currently a Sr. Principal Scientist supporting preformulation and material characterization within Pharmaceutical R&D at Boehringer Ingelheim Pharmaceuticals in Ridgefield, CT. He has previously held positions Parke-Davis/Warner Lambert (preformulation and physical characterization) and Pfizer (solid dosage development and material science) in Groton, CT. He also served as Assistant Professor on the Pharmaceutics faculty at the University of Iowa, College of Pharmacy. His areas of expertise include solid-state characterization and form selection for compound development, application of material sparing methods for formulation development and surface characterization of pharmaceutical materials. He is a contributor of several monographs to the Handbook of Pharmaceutical Excipients, has published over 25 peer-reviewed articles and is the Industrial Advisory Board Chairperson for the Center for Pharmaceutical Processing Research (CPPR) NSF Research Consortium.
References
- S.P.F. Miller, A.S. Raw, L.X. Yu, Scientific Considerations of Pharmaceutical Solid Polymorphism in Regulatory Applications, in: R. Hilfiker (Ed.) Polymorphism: In the Pharmaceutical Industry, Wiley-VCH Verlag GmbH & Co., Weinheim, 2006, pp. 385-403.
- R. Govindarajan, R. Suryanarayanan, Processing-induced Phase Transformations and Their Implications on Pharmaceutical Product Quality, in: R. Hilfiker (Ed.) Polymorphism in the Pharmaceutical Industry, Wiley-VCH Verlag GmbH & Co. KGaA, Weinheim, Germany, 2006, pp. 333-364.
- K.R. Morris, U.J. Griesser, C.J. Eckhardt, J.G. Stowell, Theoretical approaches to physical transformations of active pharmaceutical ingredients during manufacturing processes, Adv. Drug Deliv. Rev., 48 (2001) 91-114.
- P.L.D. Wildfong, Effects of Pharmaceutical Processing on the Solid Form of Drug and Excipient Materials, in: H.G. Brittain (Ed.) Polymorphism in Pharmaceutical Solids, Informa Healthcare, Inc., New York, 2009, pp. 510-559.
- G.G.Z. Zhang, D. Law, E.A. Schmitt, Y. Qiu, Phase transformation considerations during process development and manufacture of solid oral dosage forms, Adv. Drug Deliv. Rev., 56 (2004) 371-390.
- A.M. Campeta, B.P. Chekal, Y.A. Abramov, P.A. Meenan, M.J. Henson, B. Shi, R.A. Singer, K.R. Horspool, Development of a targeted polymorph screening approach for a complex polymorphic and highly solvating API, J. Pharm. Sci., 99 (2010) 3874-3886.
- B.P. Chekal, A.M. Campeta, Y.A. Abramov, N. Feeder, P.P. Glynn, R.W. McLaughlin, P.A. Meenan, R.A. Singer, The challenges of developing an API crystallization process for a complex polymorphic and highly solvating system. Part I, Organic Process Research and Development, 13 (2009) 1327-1337.
- W.P. Findlay, D.E. Bugay, Utilization of Fourier transform-Raman spectroscopy for the study of pharmaceutical crystal forms, J. Pharm. Biomed. Anal., 16 (1998) 921-930.
- A. Heinz, C.J. Strachan, K.C. Gordon, T. Rades, Analysis of solid-state transformations of pharmaceutical compounds using vibrational spectroscopy, J. Pharm. Pharmacol., 61 (2009) 971-988.
- C.M. McGoverin, T. Rades, K.C. Gordon, Recent pharmaceutical applications of Raman and Terahertz spectroscopies, J. Pharm. Sci., 97 (2008) 4598-4621.
- K.R. Morris, S.L. Nail, G.E. Peck, S.R. Byrn, U.J. Griesser, J.G. Stowell, S.J. Hwang, K. Park, Advances in pharmaceutical materials and processing, Pharm. Sci. Technol. Today, 1 (1998) 235-245.
- P.L.D. Wildfong, B.C. Hancock, M.D. Moore, K.R. Morris, Towards an understanding of the structurally based potential for mechanically activated disordering of small molecule organic crystals, J. Pharm. Sci., 95 (2006) 2645-2656.
- B. Shah, V.K. Kakumanu, A.K. Bansal, Analytical techniques for quantification of amorphous/crystalline phases in pharmaceutical solids, J. Pharm. Sci., 95 (2006) 1641- 1665.
- M.T. am Ende, A. Berchielli, A Thermodynamic Model for Organic and Aqueous Tablet Film Coating, Pharm. Dev. Technol., 10 (2005) 47 - 58.
- S. Bates, G. Zografi, D. Engers, K. Morris, K. Crowley, A. Newman, Analysis of Amorphous and Nanocrystalline Solids from Their X-Ray Diffraction Patterns, Pharm. Res., 23 (2006) 2333-2349.
- S.P. Chamarthy, R. Pinal, The nature of crystal disorder in milled pharmaceutical materials, Colloids and Surfaces A: Physicochemical and Engineering Aspects, 331 (2008) 68-75.
- T. Feng, R. Pinal, M.T. Carvajal, Process induced disorder in crystalline materials: Differentiating defective crystals from the amorphous form of griseofulvin, J. Pharm. Sci., 97 (2008) 3207-3221.
- B.S. Luisi, A. Medek, Z. Liu, P. Mudunuri, B. Moulton, Milling-induced disorder of pharmaceuticals: One-phase or two-phase system?, J. Pharm. Sci., 101 (2012) 1475-1485.
- S. Bates, R.C. Kelly, I. Ivanisevic, P. Schields, G. Zografi, A.W. Newman, Assessment of defects and amorphous structure produced in raffinose pentahydrate upon dehydration, J. Pharm. Sci., 96 (2007) 1418-1433.
- S. Šašić, M. Whitlock, Raman mapping of low-content active-ingredient pharmaceutical formulations. Part II: Statistically optimized sampling for detection of less than 1% of an active pharmaceutical ingredient, Applied Spectroscopy, 62 (2008) 916-921.
- S. Šašić, S. Mehrens, Raman chemical mapping of low-content active pharmaceutical ingredient formulations. III. Statistically optimized sampling and detection of polymorphic forms in tablets on stability, Analytical Chemistry, 84 (2012) 1019-1025.