Abstract
The pharmaceutical industry is experiencing a growing need to improve performance driven by global competition and the increasing impact of information technology. Central to this need are good data, a characteristic of good science. Quality data are arguably more important today than ever before. It is becoming widely accepted that data are a corporate asset. The industry is also focusing on risk assessment and reduction as evidenced by FDA’s focus on data integrity. Methods and tools widely used in test method development are discussed with emphasis on how these tools reduce risk in method development, validation and use. Methods discussed include experimentation strategy, method repeatability and reproducibility, method robustness and test method performance verification.
Methods for assessing the amount of product variation that can be attributed to the manufacturing process, sampling procedures and test method are also presented. A system for effectively using management review to increase the sustainability of the risk-based approaches is presented. Pharmaceutical and biotech case studies and examples are used to illustrate the test method risk-reduction methods presented.
Data Are a Corporate Asset
Good data are a characteristic of good science. Quality data are arguably more important today than ever before. Many consider data to be a corporate asset. Data are used to develop products and processes, control our manufacturing processes (Snee 2010) and improve products and processes when needed. Quality data also reduces the risk of poor process performance and defective pharmaceuticals reaching patients.
A systematic approach is needed to create test methods that will deliver the desired quality data. The FDA (2011, 2015) and USP (2018) have provided guidance for developing and validating effective test methods. At the same time there has been renewed interest in developing risk-based methods (ICH Q9 2005). Fortunately, there are concepts, methods and tools available to build assessment and mitigation of risk into test method development and validation.
Subscribe to our e-Newsletters
Stay up to date with the latest news, articles, and events. Plus, get special offers
from American Pharmaceutical Review – all delivered right to your inbox! Sign up now!
Methods are discussed in this article that can be used to develop and validate tests to do an effective job of reducing risk in the process. Six critical risks are identified and the associated prevention and mitigation tools are presented. The concepts and methods involved will be introduced and illustrated with pharmaceutical and biotech case studies and examples.
Six Critical Risks
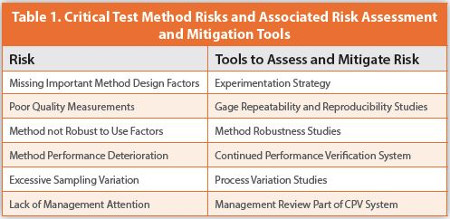
Six critical risks are identified in Table 1 along with a risk mitigation tool. These risks occur during the development, validation and lifecycle of the test method. The specific approaches are discussed in the following paragraphs.
The Risk of Missing Important Method Design Factors is always a concern even after the method has been in use. Snee (1985) reported a viscosity measurement process which had poor performance. An experimental study showed that there was a big effect due to the two spindles used in the implementation of the method. Conventional wisdom was that the two spindles were identical and that the “spindle effect” could be ignored. The data showed that differences between the two spindles to be the largest effect of the seven factors studied.
Adopting the following experimentation strategy reduces the risk of missing critical factors (Snee 2009). In this strategy a screening experiment is used to test the effects of various candidate test method variables. The screening experiment “casts a wide net” and typically identifies a large number of candidate variables. The screening experiment thus helps reduce the risk of missing any important variables. The strategy next calls for variables found to have the largest effects (both positive and negative) to be studied in a subsequent optimization experiment, the output of which is an operating window for the method that serves the same function as the Design Space for a product or process. As a result we refer to this as the “Test Method Design Space”.
This strategy was used to develop a test method involving 11 variables studied in 24 runs using a Plackett-Burman screening design (Montgomery 2017). The four variables with the largest effects were evaluated further in a 28-run optimization experiment producing the method design space. The next step in the development was to assess the effects of raw material variations.
The Risk of Poor Quality Measurements can be addressed once the method has been developed initially. This is done using a Gage Repeatability and Reproducibility study referred to as a Gage R&R Study (Montgomery 2013). In the study five to ten samples are evaluated by two to four analysts using two to four repeat tests sometimes involving two to four test instruments. A schematic of such a study is shown in Figure 1.
Output from such a study produces quantitative measures of repeatability, reproducibility and measurement resolution. These statistics are then used to evaluate the value of the method to be used for product release and process improvement. The variance estimates obtained are also often used to design sampling plans to monitor the performance of the test method over time.
Risk that the Method is not Robust to Deviation from SOP. Sometimes we find that as a test method is used the observed variation in the test results becomes too large. What do I do now you ask? One possibility is to evaluate the measurement process/procedure for robustness (called ruggedness by some authors).
A measurement method is “robust,” if it is immune to modest (and inevitable) departures from the conditions specified in the method (Youden 1961). Robustness tests study the effects of small variations in how the method is used. There are other sources of variation in a measurement method in addition to instruments and analysts which are typically the subject of Gage R&R studies. Such variables include raw material sources and method variables such as time and temperature. Robustness can be evaluated using two-level fractional-factorial designs including Plackett-Burman designs (Box, etal 2005: Montgomery 2017).
A test method is said to be robust if none of the variables studied have a significant effect. When significant effects are found a common fix is to rewrite the standard operating procedures (SOP) to restrict the variation in the variables to a range over which the variable will not have a great effect on the performance of the test method.
Lewis, et al (1999) discuss a dissolution method robustness study involving eight variables: Acid concentration, Polysorb concentration, Stir speed, Temperature, Degassing, Filter position, Operator and Apparatus. The first four factors are quantitative. The remaining four factors are qualitative. These variables were studied using a two-level Plackett-Burman design which contained twelve runs. None of the effects of the factors was statistically significant. It was concluded that the method was robust over the range of variation of the eight factors studied in the experiment. The ability to study both quantitative and qualitative factors in the same experiment illustrates the flexibility of the approach.
Risk of Test Method Performance Deterioration over Time. The FDA Guidances (2011, 2015) call for Continued Method Performance Verifi cation. An effective way to assess the long-term stability of a test method is to periodically submit “blind control” samples (also referred to as reference samples) from a common source for analysis along with routine production samples in a way that the analyst cannot determine the difference between the production samples and the control samples. Nunnally and McConnell (2007) conclude “…there is no better way to understand the true variability of the analytical method”.
The control samples are typically tested two to three times (depending on the test method) at a given point in time. The sample averages are plotted on a control chart to evaluate the stability (reproducibility) of the method. The standard deviations of the repeat tests done on the samples are plotted on a control chart to assess the stability of the repeatability of the test method.
Weitzel, et al (2015) describe a study in which a control sample was used to monitor an assay measurement process over a six-year period. The method was found to have some reproducibility issues in that one analyst had much wider variation than the other analysts. The overall variation of the method was found to be within the goal of the method. Another useful analysis to perform is to do an analysis of variance of the control sample data and compute the percent long-term variation which measures the stability of the test method over time. Long term variation variance components < 30% are generally considered good with larger values suggesting the method may be having reproducibility issues (Snee and Hoerl 2012).
Risk of Poor Sampling Performance. Sometimes when the process variation is perceived to be too high it is not uncommon to think that the test method is the root cause. Sometimes this is the case but often it is not. In such situations there are typically three sources of variation that may contribute to the problem: the manufacturing process and the sampling process as well as the test method (Snee 1983). Nested sampling studies are used to study variation in such cases (Box, et al 2005, Montgomery 2017)
Sometimes the sampling method is the issue. In one case the variation was too high because the sampling procedure was not followed (Box, et al 2005). When the correct method was used the sampling variance dropped by 30%. In another case each batch was sampled three times.
When the process variance study was run sampling contributed only 6% of the total variance. The Standard Operating Procedures were changed immediately to reduce the samples to two per batch; thereby cutting sampling and testing costs by one-third. A study was also initiated to see if one sample per batch would be sufficient.
Risk of Lack of Management Attention
We often hear the comment that test methods receive insufficient attention from management. If management put test methods higher on their priority list more resources would be made available to support measurement systems. One way to get management attention for test methods is to include method performance data as part of the management review of production data. Such a process is shown in Figure 2.
Figure 2 is a schematic of a system that links the process, its data and analysis, management review, process adjustment and process improvement (Snee 2015). This results in a system for Continued Process Verification called for in the FDA Process Validation Guidance (FDA 2011). When we add test method performance data to the system we get Continued Method Performance Verification (CMPV) discussed in the USP Guidance (2018).
I refer to management review as the “secret sauce”. Requiring management review of measurement system on a periodic basis is a giant step forward toward the long-term sustainment of effective measurement systems. Management review is a ‘team sport” done by different management teams at different times such as process operators (daily/ hourly), area management (weekly), Site Management (Monthly) and Business Management (quarterly). The management review plan should devised to suit the needs of the business.
When to Do the Risk-Based Studies
These risk reduction tools are used at different points in time during the test method development, validation and use. The experimentation strategy of using screening experiments followed by optimization experiments is typically done during method design (Stage 1). Gage R&R and robustness studies are best done during Stage 2 after the test method has been developed. Sampling studies can be done in Stage 2 or Stage 3. Test method stability evaluation and management review are done throughout the life of the test method in Stage 3. Gage R&R, robustness, and sampling studies are also troubleshooting tools that can be used at any time when the test method is not performing as designed.
It is concluded that the test method risk reduction concepts, methods and tools discussed here improve test method performance and reduce the risk of poor manufacturing process performance and defective pharmaceuticals reaching patients. Risk is reduced as the accuracy, repeatability and reproducibility increases. Reduced variation is a critical characteristic of good data quality as reduced variation results in reduced risk.
References
- Box, G. E. P., J. S. Hunter and W. G. Hunter (2005), Statistics for Experimenters, 2nd Edition, John Wiley and Sons, New York, NY, 345-353
- FDA (2011) Process Validation Guidance for Industry, US Food and Drug Administration, Center for Drug Evaluation and Research (CDER)
- FDA (2015) Analytical Procedures and Methods Validation for Drugs and Biologics
- Guidance for Industry, US Food and Drug Administration, Center for Drug Evaluation and Research (CDER), Center for Biologics Evaluation and Research (CBER)
- ICH (2005) Quality Risk Management (Q9), ICH Harmonized Tripartite Guideline
- Lewis, G.A., Mathieu, D. and Phan-Tan-Luu, R. (1999) Pharmaceutical experimental design, Marcel Dekker, New York.
- Montgomery, D. C. (2013), Introduction to Statistical Quality Control, 7th Edition, John Wiley and Sons, New York, NY.
- Montgomery, D. C. (2017), Design and Analysis of Experiments, 8th Edition, John Wiley and Sons, New York, NY.
- Nunnally, B. K. and J. S. McConnell (2007) Six Sigma in the Pharmaceutical Industry: Understanding, Reducing, and Controlling
- Variation in Pharmaceuticals and Biologics, CRC Press, Boca Raton, FL Snee, R. D. (1983), “Graphical Analysis of Process Variation Studies”, J. Quality Technology, 15, 76-88.
- Snee, R. D. (2009) “Raising Your Batting Average” Remember the Importance of Sequence in Experimentation”, Quality Progress, December 2009, 64-68.
- Snee, R. D. (2010) “Crucial Considerations in Monitoring Process Performance and Product Quality”, Pharmaceutical Technology, October 2010, 38-40.
- Snee, R. D. (2015) “Management Holds the Key to Continued Process Verification”, Pharmaceutical Manufacturing, January/February 2015, 33-35.
- Snee, R. D. and R. W. Hoerl (2012) “Going on Feel: Monitor and Improve Process Stability to Make Customers Happy”, Quality Progress, May 2012, 39-41
- USP (2018) Proposed New USP General Chapter: The Analytical Procedure Lifecycle <1220>
- Weitzel, J., R. A. Forbes and R. D. Snee (2015) “Use of the Analytical Target Profile in the Lifecycle of an Analytical Procedure: with an example for an HPLC Procedure”, J. of Validation Technology, Vol. 20, Issue 4, Jan 2015
- Youden, J. (1961) “Systematic errors in physical constants”. Physics Today, 14, No.9, 32-42.
Author Biography
Ronald D. Snee, PhD is president of Snee Associates, a firm dedicated to the successful implementation of process and organizational improvement initiatives. He worked at the DuPont Company for 24 years prior to initiating his consulting career. He also serves as an Adjunct Professor in the Pharmaceutical programs at Temple University and Rutgers University. Ron received his BA from Washington and Jefferson College and MS and PhD degrees from Rutgers University. He is a fellow of the American Society of Quality, American Statistical Association, and American Association for the Advancement of Science. He in an Honorary Member of ASQ and has received more than 30 awards and honors, published seven books and more than 330 papers in the fields of performance improvement, quality, management, and statistics. He can be reached at Ron@SneeAssociates.com
Copyright: 2019 Ronald D. Snee