Plough Center for Sterile Drug Delivery Solutions
UT Plough Center, Memphis
Plough Center for Sterile Drug Delivery Solutions
Introduction
One of the key quality attributes for evaluating effectiveness of the cleaning and disinfection program is the in-situ validation.1,5,8 The requirement can be accomplished by performing expansive environmental monitoring in the area after a triple clean is conducted. The triple cleaning process does not have a standalone standardized definition in the industry yet. The closest definition of the triple cleaning process reported so far is to use the disinfectant two times followed by the sporicide.2,3,4 There are other processes utilized in the industry for bringing the facility online after a worst-case event such as Vaporized Hydrogen Peroxide® (VHP) bio-decontamination application, fogging application, or a 9X cleaning.3,7
The disinfectant efficacy study starts with in-vitro studies, where the efficacy of sanitizers/disinfectants/sporicidal agents is evaluated on representative cleanroom substrates (coupons) with in-house isolates, or reference strains (for a new facility). The in-vitro tests simulate as closely as possible the actual cleanroom conditions such as temperature, cleanroom substrates, and the type of microorganisms. After the sanitizers/disinfectants/sporicidal agents successfully pass the efficacy tests, the qualification process moves into stage 2 – in-situ testing, where the performance of the sanitizers/disinfectants/sporicidal agents will be evaluated under the actual worst-case conditions in the cleanroom. Stage 3 is the continuous monitoring and trending of the environmental data over time, to ensure the cleaning and disinfection program continues to be effective in the control of bioburden in the cleanroom environment.

The goal of the current case study is to evaluate the effectiveness of the triple cleaning process involving applications of low pH phenolic disinfectant, high pH phenolic disinfectant, followed by the application of a hydrogen peroxide/peracetic acid sporicidal agent. The worst-case event was caused by equipment installation, room pressure modification, and facility construction. The triple cleaning process was performed post maintenance to the Heating, Ventilation, and Air Conditioning (HVAC) system which controls humidity in the cleanroom operation.
The triple cleaning process is a very valuable tool to indicate the overall effectiveness of the cleaning and disinfection program and bringing the facility back online post disruptive events. Industry regulators including FDA (United States Food and Drug Administration), HPRA (Health Products Regulatory Authority), ANVISA (Brazilian Health Regulatory Agency), ANMAT (National Administration of Drugs, Foods and Medical Devices), ANSM (National Agency for the Safety of Medicines and Health Products), CFDA (China Food and Drug Administration), and MHRA (Medicines and Healthcare Products Regulatory Agency) view the in-situ validation data gathered during the triple cleaning has signifi cant value in disinfectant validation process. The coupon testing data and the environmental monitoring data over time are also key elements of the disinfectant validation program. The in-situ testing based on a triple cleaning (3X-cleaning) has clear evidence for its efficacy for controlling bioburden in the cleanroom after a worst-case event.
Method of Evaluation
This case study was conducted at the University of Tennessee Health Science Center - Plough Center for Sterile Drug Delivery Solutions. This in-situ study was performed in the ISO-5 and ISO-7 cleanrooms which had to shut down for engineering and construction work. The engineering and construction work involved equipment installation, room pressure modification, and facility HVAC installations. The facility shutdown also involved shutting down HVAC systems that supply HEPA filtered air to the ISO-5 and ISO-7 cleanrooms.
After the construction work was completed, the cleanrooms were to be restored to cleanroom sterile production conditions. This task is accomplished by performing the cleaning and disinfection procedure based on a written protocol that is audited and approved by the Quality Assurance Team of the facility. The following sanitizing procedure was followed from the written protocol:
- A low pH and high pH phenolic one-step disinfectant cleaner were used for broad spectrum germicidal activity. The use of dilution solution for both the low pH and high pH phenolic disinfectants was maintained at 0.8% v/v. The hydrogen peroxide peracetic acid sporicidal agent used in this case study was known to provide a fast and effective microbial control including bacterial and fungal spores. The wet contact times of the disinfectants and sporicides in the cleanrooms was 10 minutes. No precleaning of surfaces was required prior to disinfectant application because these products are one-step cleaner and disinfectants.
- No rinsing was conducted between steps. Each product was applied and allowed to air dry and matched or exceeded the wet contact time used in the In-Vitro study. No rinsing was conducted after the steps were completed. This facility does conduct a rinse step once a month after routine sporicide application and sufficiently controls the residue.
- All cleaning and disinfection were performed using the two-bucket system. The two-bucket system was secured on a stainless-steel trolley system equipped with color-coded buckets, a duo press mop wringer, duo plus frame, extendable universal handle, and individually sterile wrapped microfiber laminated mop.

Environmental Monitoring was performed on three consecutive days (March 4 - 6, 2020) with cleaning and disinfection performed between T0 and T1 sampling and before sampling on T2 and T3 (refer to Figure 1). All environmental monitoring locations remain the same for T0 (baseline monitoring), after the first disinfection (T1), after the second disinfection (T2) and after the third sporicidal application (T3), including floor surface, wall surface, counter/equipment surface and air viable.
Time zero (T0) data was collected on March 4, 2020, with environmental monitoring assessment in ISO-5 and ISO-7 classification areas. The environmental sampling points were conducted at worst case locations such as high touch points and high traffic areas in the cleanroom operation (refer to Tables 1 and 2 for the sampling points in ISO-5 and ISO-7 Cleanrooms). The environmental monitoring consisted of RODAC® plating, settle plating, active air sampling, and swabbing at worst-case locations in the cleanrooms.
The media plates used were Trypticase™ Soy Agar (TSA) Sterile Plates with Lecithin and Polysorbate 80 RODAC plates, and Trypticase™ Soy Agar Settling plates. All lots of media plates were tested for growth promotion and passed. The plates used for Environmental Monitoring of the current study were stored at 2-8°C refrigerated temperatures.
Immediately after sampling, all media plates were incubated between 20 to 25°C for no less than 72 hours. After initial incubation, all media plates were transferred to an incubator set between 30 to 35°C for no less than 48 hours. After all the sampled plates were pulled from the 30 to 35°C incubators, they were read using the colony counter.
Results and Discussion
Environmental sampling locations for filling and compounding areas are shown in Diagram 1 and 2.
ISO-5 Cleanroom
Table 1 shows the summary of the environmental monitoring data results for ISO-5 cleanroom. The type and locations of samples collected are:
From Table 1, it was observed that all the air viable and surface sampling points show no counts from T0 to T3. This may be due to the clean surface conditions during shutdown. Most of the counts are from the floor sampling (refer to Table 1 and Graph 1) and this is expected as the floor is typically the worst-case area of any cleanroom. At baseline time T0, there were only two locations that showed growth with a total of six counts. Both locations are from the floor samples. After the cleaning and disinfection using a low pH phenolic disinfectant, the total microbial count decreased to 2 at T1. After application of a high pH phenolic disinfectant, the total microbial count decreased to 1 at T2. Finally, after the application of hydrogen peroxide/peracetic acid sporicidal agent, there was no microbial counts found for all sampling locations at T3.
Subscribe to our e-Newsletters
Stay up to date with the latest news, articles, and events. Plus, get special offers
from American Pharmaceutical Review – all delivered right to your inbox! Sign up now!
From the above analysis, a progressive reduction in the grand total number of microbial counts for all the sampling locations was observed from baseline sampling point T0 to sampling time point T3 after last cleaning and disinfection (refer to Graph 1). The triple clean for ISO-5 cleanroom using low pH phenolic disinfectant, followed by high pH phenolic disinfectant, and finally hydrogen peroxide/peracetic acid sporicidal agent is effective in the reduction of bioburden to meet the bioburden acceptance criteria for the ISO-5 cleanroom and enable it to be ready for manufacturing activities.
ISO 7 Cleanroom
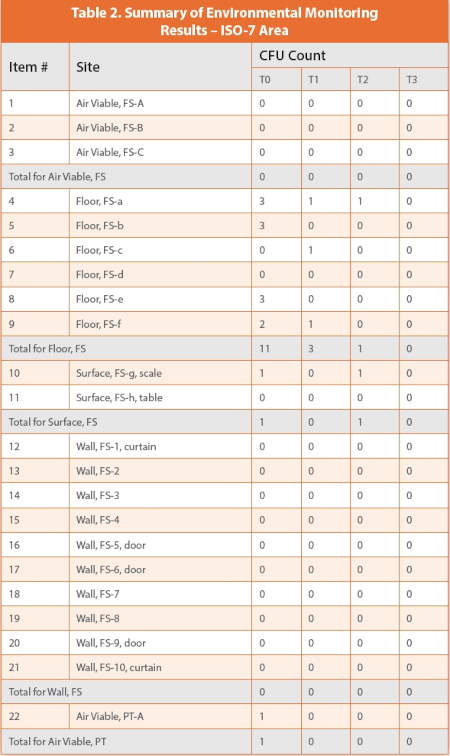
Table 2 shows the summary of the environmental monitoring data results for ISO-7 cleanroom. The type and locations of samples collected are:
- 9 air viable sampling
- 6 surface contact plates swabs on door, curtain, bench, scale, cabinet
- 18 floor contact plates
- 29 wall contact plates
From Table 2, it was observed that all the Wall FS, Wall PT, Wall CR, Wall AG, and Wall EH sampling points show no counts from T0 to T3. This is because the wall surfaces are relatively clean since most of the wall surfaces are not high touch point surfaces compared to the floor surfaces. Surface bench AG-b and air viable FS-A, FS-B, FS-C and surface FS-h, table sampling points also show no counts from T0 to T3.
The initial sampling at time T0, for Surface CR-b scale shows relatively high count (11) compared to other surfaces, CR-a (bench) and CR-c (cabinet), but after the first cleaning and disinfection using low pH phenolic disinfectant, the count reduced to 0 for all the surfaces (CR-a: bench, CR-b: scale, CR-c: cabinet) from T1 to T3.
The floor sampling for CR shows slight decrease in counts after application of low and high pH phenolic disinfectants: T0 (26), T1 (20) and T2. (19). After application of hydrogen peroxide peracetic acid RTU (Ready-to-Use) sporicidal agent, all the CR floor surfaces have zero counts at T3.
The floor sampling for AG-a and AG-c shows a decrease in counts after application of low pH phenolic disinfectant: T0 (18), T1 (5). However, there is an increase in total counts to 59 at T2 (AG-a: 28, AG-c: 31). The increase in counts at two T2 data collection points are because this is the floor in an aseptic gowning area and carts and high traffic occur in the area. The counts may have been due to bacterial endospores from cartwheels or foot traffic from personnel activity in the gowning room. Additionally, post sporicidal application at T3 eliminated all the counts in the AG aseptic gowning areas. All the other ISO 7 cleanrooms showed good control of bioburden levels.
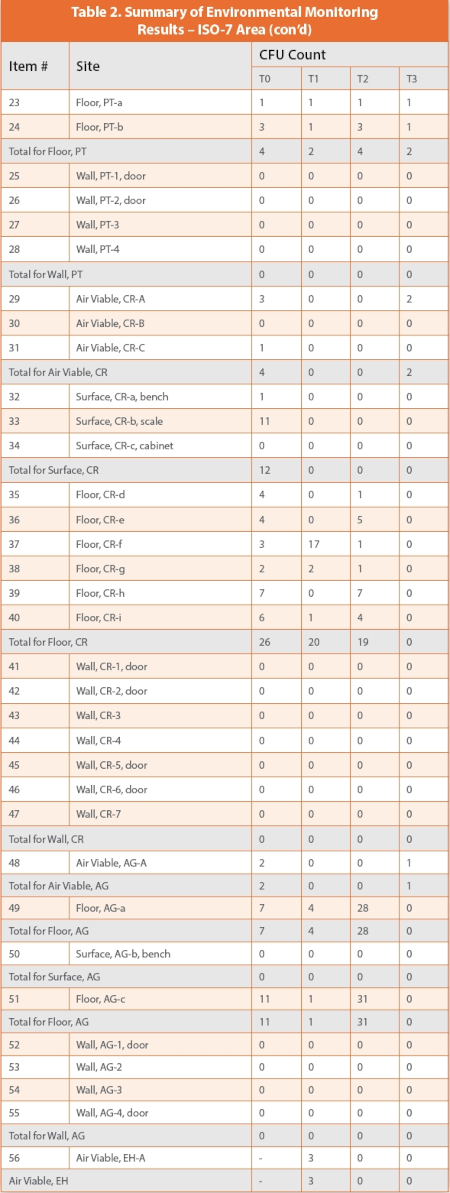
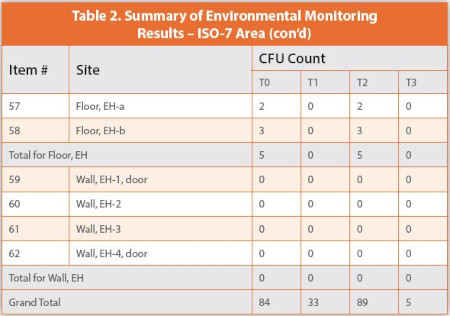
For the sampling on air viable (PT-A), air viable CR-C, floor EH-a, floor EH-b, Floor FS-a to FS-f and Surface FS-g scale, there are some counts between T0 to T2, but after the triple clean using low and high pH phenolic disinfectants followed by hydrogen peroxide/peracetic acid sporicidal agent, all these sampling points do not have any microbial counts at sampling time point T3.
For floor PT-a, PT-b, air viable CR-A, air viable AG-A, there are low counts between 1 and 3 from T0 to T3, probably due to the operator activities in these cleanrooms. However, the low counts still meet the acceptance criteria for ISO-7 cleanroom.
Based on the environmental monitoring data, it was observed that at baseline time T0, there were 23 locations (out of a total of 62 locations) with a total of 84 counts. After the cleaning and disinfection using a low pH phenolic disinfectant, the total count decreased significantly to 33 at T1. However, the total count unexpectedly increased to 89 at T2. This is due to two outliers based on the data analysis and investigation on the floor sampling locations AG-a and AG-c which are the aseptic gowning rooms that have carts and material transfer frequently as well as high levels of personnel activity. Outliers in environmental sampling happens in cleanroom data trending on occasion.6 If the counts at these two locations are excluded, the total count at T2 would be 28, which is a slight decrease from T1. Finally, after application of hydrogen peroxide/peracetic acid sporicidal agent, the total number of microbial counts decreased significantly to 5 at T3. At the end of time point T3, all the sampling points met the acceptance criteria for the microbial count in ISO-7 area.
From the above analysis, although there is an increase of microbial counts from T1 to T2 due to the two outlier floor sampling points, the data shows a progressive reduction in the bioburden level (excluding the two outliers) was observed from T0 to T3 after the last cleaning and disinfection using hydrogen peroxide peracetic acid sporicidal agent. The triple clean for ISO-7 cleanroom using low pH phenolic disinfectant, followed by high pH phenolic disinfectant, and finally hydrogen peroxide/peracetic acid sporicidal agent is effective in the reduction of bioburden to meet the acceptance criteria for the ISO-7 cleanrooms to be ready for manufacturing activities.
Facility
The cleanroom facility selected for the current case study was the newly built cleanroom facility owned and operated by the University of Tennessee Health Science Center- Plough Center for Sterile Drug Delivery Solutions. The campus of the University of Tennessee Health Science Center is as much a home to a major health care education institution these days as it is ground zero for major development projects poised to come online soon. Plough Center consists of over 800-square-foot PODs that are well-integrated as cleanrooms and form the guts of UTHSC’s newest entrepreneurial venture, the Plough Center for Sterile Drug Delivery Solutions, a state-of-the-art, contract pharmaceutical manufacturing facility. The new Plough Center, located at 208 South Dudley Street near downtown Memphis, is the only pharmaceutical facility of its kind in Tennessee and one of the few universities owned contract manufacturing facilities in the United States. It is expected to raise the university’s standing in the national and global marketplace and position the university to help speed the process of bringing new drugs to market.
Conclusion
A progressive reduction in microbial count was observed from baseline T0 to T3 for ISO-5 cleanrooms, after the last cleaning and disinfection using hydrogen peroxide/peracetic acid sporicidal agent. For ISO-7 cleanrooms, a significant reduction in microbial counts was observed from baseline T0 to T3, although there is a spike in the microbial counts from T1 to T2 due to two floor locations with outliers in the aseptic gowning room due to increased cart movement, material transfer and personnel activity. The risk assessment revealed that the cart and material transfer as well as elevated personnel activity is the assignable cause. After the last cleaning and disinfection using hydrogen peroxide/peracetic acid sporicidal agent, only five microbial counts are recorded for all the sampling points in ISO-7 cleanrooms. This case study demonstrates the efficacy of the triple clean using low pH phenolic disinfectant, high pH phenolic disinfectant, and hydrogen peroxide/peracetic acid sporicidal agent to reduce the bioburden level in the ISO-5 and ISO-7 cleanrooms to acceptable levels for production startup after the shutdown activities. The environmental monitoring data over time shows the overall effectiveness and robustness of the cleaning and disinfection program.
References
- Polarine, J. and Walker, T. Evaluation of a Quaternary Ammonium Ready-to-Use (RTU) Disinfectant and Hydrogen Peroxide/Peracetic Ready to Use (RTU) Combination Sanitization Regimen for Cleanroom Start-Up. American Pharmaceutical Review, May-June 2020.
- Polarine J., Kroeger, B. HOW ISSUES RELATED TO UTILITIES, SURFACES AND PRACTICES IMPACT CLEANROOM ENVIRONMENTS, Contamination Control in Healthcare Product Manufacturing, Volume 4 PDA/DHI Publishing, June 1, 2016
- Polarine J., Kroeger, B. Bringing Cleanrooms Online Initially and After a Worst-Case Event, PDA Poster at PDA Annual Meeting 2015, March 10, 2015.
- Polarine J., Kroeger B., Start-up of cleanrooms, initially and after a worst-case event., Clean Air and Containment Review, August 15, 2017.
- IEST-RP-CC-018.5 Cleanroom Cleaning and Sanitization: Operating and Monitoring Procedures., IEST May 2020.
- Ildikó no Ziegler, Judit no Borbély-Jakab, Lilla no Lilla Sugó and Réka J. Kovács. Revision of Viable Environmental Monitoring in a Developmental Pilot Plant Based on Quality Risk Assessment: A Case Study. PDA Journal of Pharmaceutical Science and Technology January 2017.
- Anne Marie Dixon, Ch. 11, Cleaning of Non-Product Contact Surfaces in Cleaning and Cleaning Validation for the Pharmaceutical and Medical Device Industries, Vol. 1 Basics, Expectations, and Principles. Paul L. Pluta, Ed., PDA, Bethesda, MD, and DHI Publishing, LLC, River Grove, IL. 2009.
- PDA Technical Report Number 70, “Fundamentals of Cleaning and Disinfection Programs for Aseptic Manufacturing Facilities”. 2015.