Department of Drug Product Development
Abstract
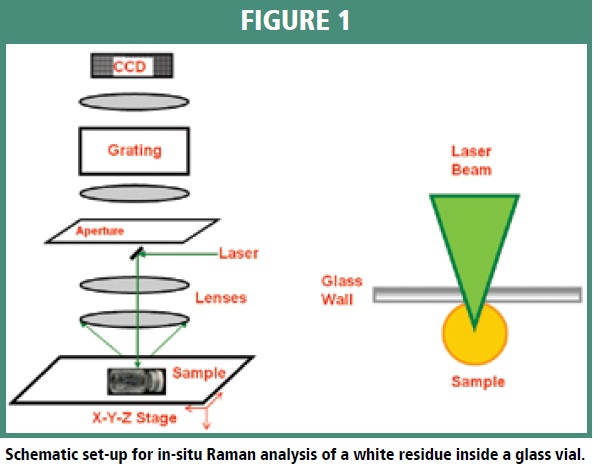
Raman spectroscopy and Raman microscopy are powerful techniques for solid-state in situ protein pharmaceutical analysis within glass containers or for isolated samples. The laser beam of a confocal Raman microscope can be focused sharply on extremely small particles to obtain high quality Raman spectra. The penetration of visible laser light through glass enables in-situ analysis to be performed without any sample manipulation. The characteristic fingerprint feature of Raman spectra for proteins allows differentiation between protein product and placebo and between different protein products. Examples using Raman spectroscopy and Raman microscopy to investigate protein gelation, determine protein identity and investigate filling process incidents are presented.
Introduction
Advances in Raman spectroscopy technology in the last two decades have produced a range of Raman techniques suitable for biopharmaceutical applications. This includes Fourier Transform (FT)-Raman, dispersive visible Raman, chiral Raman, UV resonance enhanced Raman, surface enhanced Raman, confocal Raman microscopy (1) as well as hand-held Raman devices. Each Raman technique has its unique advantages and disadvantages in terms of instrument sensitivity and suitability for measurement of samples in situ in glass containers, as a solution, a gel, a solid or after appropriate sample preparation steps. For example, UV resonance enhanced Raman instruments provides high resolution and excitation wavelength selectivity to probe protein chromophores such as tryptophan, tyrosine and phenylalanine at 229 nm (2). Chiral Raman can determine the absolute configuration of chiral drug molecule in solution (3). Surface enhanced Raman instruments offer the highest sensitivity and can detect single molecules (4). These Raman techniques are all suited to study proteins in solutions. The best Raman technique to probe protein pharmaceuticals in the solid state within their primary containers such as pre-filled syringes and glass vials is confocal Raman microscope (5, 6). This is because the transparency of glass to the laser beam allows direct sharp focusing on very small visible and sub-visible particles down to low micron size using the high magnification provided by the Raman microscope. More importantly, high Rayleigh scattering background from solid state samples within curve-shaped glass containers can be filtered out using the confocal technology.
Detailed structural information can be obtained from the Raman spectrum of protein pharmaceuticals. This includes the secondary structure of the protein backbone, the state of the hydrogen bonding, the structural conformation, configuration of local environments of side chains and intermolecular interactions (1, 7). For solid-state protein pharmaceuticals, the Raman spectrum not only provides information about the protein but also about the excipients. Hence we can obtain information about the distribution, crystal habit and polymorphism of the excipients when a Raman analysis is performed on lyophilized products (8, 9). An application of structural characterization of protein pharmaceuticals by Raman microscopy is forensic analysis of contaminants or unexpected residues found in drug product vials and syringes (10, 11). Also, Raman microscopy has been used to differentiate protein product from placebo and differentiate drug counterfeits from authentic products (12). Another protein pharmaceutical manufacturing application using Raman microscopy is non-conformance investigation to quickly confirm the presence and identity of foreign particles in primary glass containers by in-situ analysis (10). In this article, we discuss a few examples of applications of Raman spectroscopy in protein pharmaceutical manufacturing for solutions and solids in primary glass containers. This includes Raman application to protein gelation, protein product identification, insitu analysis of residues in primary containers as well as investigating manufacturing incidents during the drug product filling operation.
Experimental
All optical pictures of the samples in glass containers were obtained on a stereomicroscope and a high resolution optical microscope. Raman spectra of gels in pre-filled glass syringe or glass vial are measured in-situ with a Raman Microscope. For these measurements, the glass container was placed directly on the XYZ sample stage of the Raman microscope. Suspect residues on the internal surface of a glass container or on the external surface were not removed during analysis. Figure 1 shows the schematic set-up for an in situ Raman microscopic analysis. A green 532 nm laser with 20 mW power was used for all in situ measurements. The laser beam was focused sharply on the samples with fine tuning of the objective and precise positioning of the XYZ sample stage. A combination of a 20x magnification objective lens and a 50 x 1000 μm confocal aperture on the Raman microscope were used. Each Raman spectrum was obtained from 100 scans which were averaged to increase the signal to noise ratio. The spectral resolution of the Raman microscope was set at ~12 cm-1. The Raman spectrum was background subtracted prior to display. However, a few notable sharp cosmic ray lines in the spectrum were not removed.
Raman spectra of proteins in aqueous solutions were measured by a chiral Raman. The samples were placed in a 200 μL quartz cuvette. It employs a solid state laser which emits a 532 nm line up to 5 W power. The chiral Raman has a spectral coverage of 300-2700 cm-1 single scan and a spectral resolution of ~10 cm-1. All protein solution spectra were collected with 1 W laser power and 5 minutes exposure time. The Raman spectra were buffer subtracted and baseline corrected.
Protein Gelation
High dose protein therapeutics (above 50 mg/mL) can form gels under unfavorable conditions such as excessive heat. Protein gelation is a complicated process and its mechanism is not well understood (13). It is generally accepted that protein gelation results when the native protein dentures, unfolds, aggregates and then develops into a three dimensional network. Little structural information on protein gels has been documented. Raman spectroscopic analysis of protein gels could give some insight into protein gelation from a molecular and structural perspective since it provides distinctive features for folded and unfolded proteins.
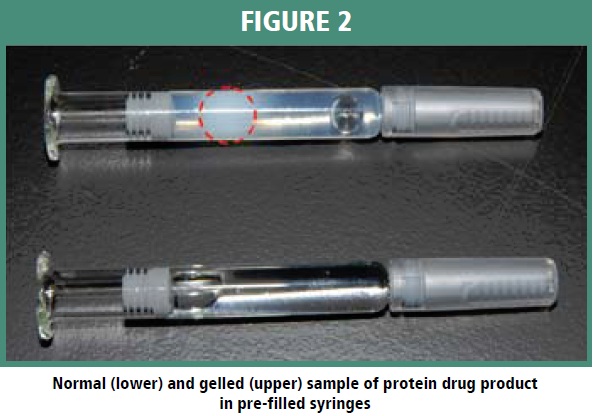

Figure 2 shows pre-filled syringes of a protein drug product as its normal clear solution and as a gel when the syringe was subjected to unfavorable heating conditions during the filling operation. The Raman spectra for these two pre-filled syringes, Figure 3, show the fingerprint region (600 to 1800 cm-1) in the left panel which provides information on the secondary structure of the protein backbone plus conformational information provided by species such as the aromatic amino acids. The higher frequency region above 2000 cm-1, shown in the right panel, contains information on intra- and inter-molecular bonding and non-bonding interactions promoted by moieties such as SH, CH2, CH3, NH as well as a distinctive OH band for hydrogen-bonded water. The spectra for the high frequency region show that the ratio of the band intensity of the CH2:OH groups at 2940 cm-1 and 3417 cm-1, respectively, is much higher (3 times) for the gelled protein compared to the protein in solution in water. This is indicative of water depletion in the gelled state versus the solution state facilitated by heating conditions (13). It had been reported that upon complete dehydration in dried proteins, the OH band completely disappears and a sharp but weak NH band emerges (3). The spectra for the low frequency region show an increase in tryptophan band intensity at 1553 cm-1 for the gelled protein compared to the protein in solution, indicative of a more hydrophobic and rigid environment in the gel (1, 15). The intensity of the additional tryptophan band at 1006 cm-1 is also significantly enhanced in gelled protein.
Protein Product Differentiation
Raman spectroscopy can be used effectively for identification of protein therapeutics throughout manufacturing, packaging, shipping and storage with the flexibility of executing the testing with a hand-held device (16). Disulfide bonds, free cysteine groups and aromatics have large polarizability and exhibit distinctive Raman features even though some of them are overlapped with the bands of the polypeptide backbone. These Raman active groups differ from one protein to another and can be used to distinguish between protein products very successfully when used in conjunction with chemometrics to process the raw data to increase identification specificity (14).

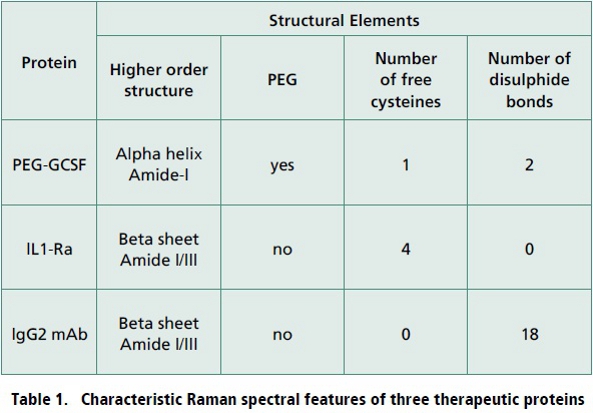
Figure 4 shows the Raman spectra for three protein therapeutics in solution. These spectra exhibit the distinguishing Raman fingerprint region (500-1700 cm-1) for the three proteins. The top spectrum is for pegylated-GCSF (PEG-GCSF) and shows the predominant alpha-helix conformation indicated by the sharp and well-resolved amide I band at 1656 cm-1. Another distinctive Raman feature of this molecule is the strong bands at 1475 cm-1 and 1290 cm-1 which are due to the vibrational modes of the polyethylene glycol chain. The middle spectrum is for an interleukin-1 receptor antagonist (IL1-Ra) with its predominant conformation being the beta-sheet indicated by the characteristic amide I band at 1674 cm-1 and amide III band at 1243 cm-1. The Raman spectra for both PEG-GCSF and IL1-Ra show very weak bands in the 2560-2570 cm-1 region. These bands are for unpaired cysteines in the molecules, some are exposed and weakly hydrogen bonded and others are embedded within the protein structure and strongly hydrogen bonded. The bottom spectrum is for an IgG2 monoclonal antibody (mAb). It has no detectable free cysteines, but has a distinct band for disulfide bonds at 496.8 cm-1. The mAb has a predominant beta-sheet secondary structure characterized by the intense amide I band at 1674 cm-1 and amide III band at 1245 cm-1. From these distinctive Raman markers for each of each these proteins, it is possible to differentiate them by inspection their Raman spectrum and confirm their identity by comparison to established reference standards. Table 1 summarizes the molecular structural features of PEG-GCSF, IL1-Ra and the mAb protein that results in distinctive Raman bands which can be used to differentiate between these three molecules. To fully utilize these distinctive Raman features to differentiate between protein therapeutics for the wide range of identification applications including solving manufacturing incidents, trouble shooting transportation deviations and executing investigations, a comprehensive spectral database of all protein therapeutics within a company’s manufacturing network is required. Also, the development of a specific analytical method for each protein therapeutic with chemometrics (14) is needed.
Filling Incident Investigation
Raman microscopy is an ideal analytical technique to investigate injectable drugs contained in glass vials or syringes during the filling manufacturing operation. In particular, it can be applied to in-situ detection of micro-droplets and micro-particles (8). During the filling process of protein drugs and placebos, visible particulates have been observed under visual inspection and quick identification of these visible particulates can be critical for completion of the filling operation and product release. In the case study discussed here, white powder residue was observed on the external surface of glass vials during the filling operation of a protein drug product. The white powder residue was analyzed in situ with both optical microscopy and Raman microscopy. The left panel of Figure 5 shows the microscopy image of the glass vial with the white residue and the right panel shows a higher magnification image of the white powder. Figure 6 shows the comparison of the Raman spectrum of the white powder on the glass vial (lower spectrum) and a reference Raman spectrum (upper spectrum) of the dried placebo (buffer components without protein product). The two Raman spectra matched each other very well by band frequency and relative intensity except for a few minor sharp spikes in the spectrum for the white powder residue which are due to cosmetic imperfections in the glass vial detected by the CCD detector on the Raman spectrometer. This comparison of the Raman data confirmed that the white powder residue on the glass vials was dried placebo, which spilled on the vials during the filling process. This evidence brought a quick closure to this investigation at the manufacturing facility.
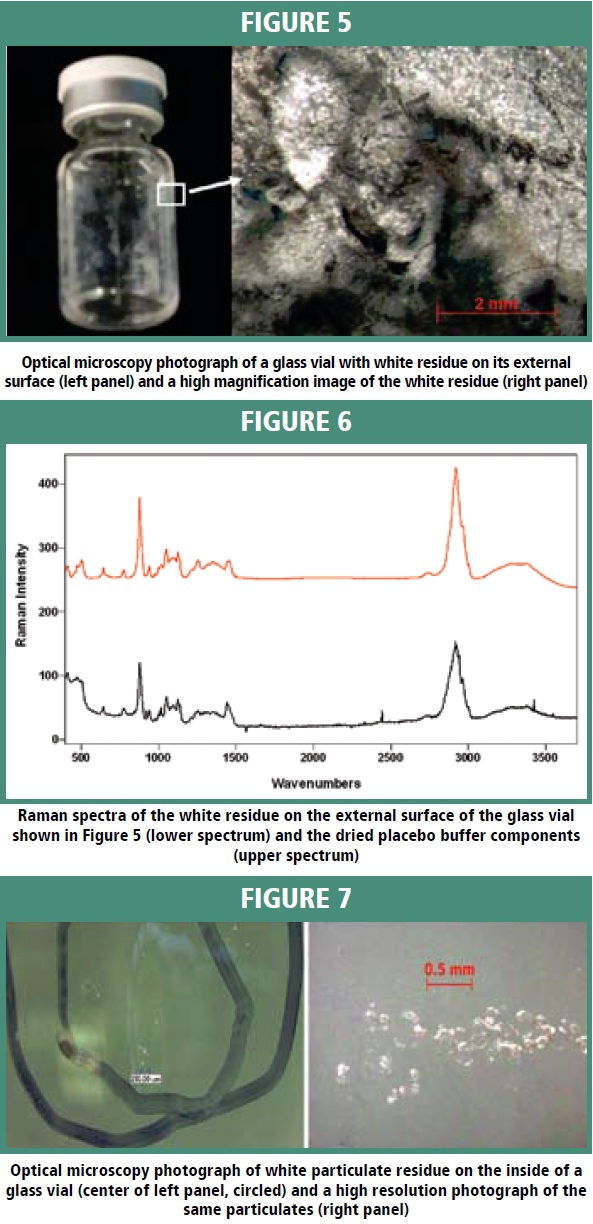
In another glass vial filling incident, trace white powder residue was observed on the inner surface of glass vials for a protein drug product during visual inspection after manufacturing. There was concern regarding whether the trace white powder residue was product-related or foreign material. Figure 7 shows the microscopy image of the white powder residue adhered to the inner surface of a glass vial (left panel) and a high resolution image of the individual white micro-particles (right panel). Figure 8 shows the Raman spectrum of the white micro-particles obtained in-situ without opening the vial (upper spectrum) and a reference Raman spectrum of the dried protein product obtained on a glass slide (lower spectrum). The two Raman spectra are consistent with each other in the frequency region below 3000 cm-1, with the spectrum of white micro-particles having low signal-to-noise due to the limited quantity of sample. The spectra exhibit the characteristic features of a protein indicated by the amide I band at 1670 cm-1, amide III band at 1245 cm-1, tryptophan bands at 1550 cm-1 and 1010 cm-1. The two Raman spectra show differences in the region above 3000 cm-1. In particular, the strong broad band at 3400 cm-1, which is the water band, which is much larger for the micro-particles above the aqueous formulation in sample vial than for the dried reference sample. The match between the Raman spectrum for the white micro-particles and the spectrum for the protein drug product reference confirmed that the white powder residue in the vial was product-related and not due to foreign materials. Subsequent analysis with FTIR and SEM/EDS (data not shown here) supported the in-situ Raman results. It was concluded that the white residue on the inside of the glass vial resulted during filling from a splash on the upper region of the glass vial above the fill line. The large head space of air in the glass vial resulted in the splash drying out to leave the white residue. Gentle swirling of the liquid in the vial re-dissolved the white residue back into the liquid formulation. Raman spectrum of the white particulate residue from Figure 7 obtained in situ (upper) and of the dried drug product sample (lower) prepared on a glass slide.

Conclusions
Raman spectroscopy is a useful technique for protein formulation analysis and investigating biopharmaceutical manufacturing incidents. In particular, it is well suited for in situ solid-state analysis in glass containers. The fingerprint feature of Raman spectrum for proteins allows it to be used to probe structural changes caused by gelling of protein drug products. The highly sensitive chiral Raman instrument can be used to characterize protein solutions at concentrations as low as 1 mg/mL, which is on par with other spectroscopic methods such as circular dichroism, fluorescence and FTIR. However, Raman microscopy can provide unique information on protein adsorption on glass surface through surface enhancement using gold nano-particle staining (17). The limit of Raman spectroscopy is instrument sensitivity, especially when the quantity of samples is limited. For lyophilized protein pharmaceuticals, it is difficult and time-consuming to obtain a characteristic protein Raman spectrum due the masking by the Raman spectrum of the excipients which are at much higher concentration than the protein. Future advances in Raman spectroscopy technology will alleviate these shortcomings and provide more applications in protein therapeutics manufacturing.
References
1. Wen, ZQ. Raman spectroscopy of protein pharmaceuticals. J. Pharmaceutical Science, 2007, 96, 2861-2878.
2. Chi, ZH.; Asher, SA. Ultraviolet resonance Raman examination of horse apomyoglobin acid unfolding intermediates. Biochemsitry, 1999, 38, 8196-8203.
3. Barron, LD.; Hecht, L.; McColl, IH; Blanch, EW. Raman Optical Activity comes of age. Molecular Physics, 2004, 102, 731-744.
4. Kneipp, K.; Wang, Y.; Kneipp, H.; Perelman, LT.; Itzkan, I.; Dasari, RR.; Feld, MS. Single molecule detection using surfaceenhanced Raman scattering. Physical Review Letter. 1997, 78, 1667-1670.
5. Everall, NJ.; Confocal Raman Microscopy: Performance, Pitfalls, and Best Practice, Appl. Spectrosc. 2009, 63, 245A-262A.
6. Wen, ZQ.; Aylin, V.; Verga F, Cao, XL.; Eu, B., Schulthesis, R.; Distribution of silicone oil in pre-filled syringes probed with optical and spectroscopic methods, PDA Journal of Sci. and Tech. 2009, 63, 150-158.
7. Wen, ZQ.; Cao, XL.; Vance, A. Conformation and side chain environments of recombinant human interleukin-1 receptor antagonist (rh-IL-1ra) probed by Raman, Raman optical activity and UV-resonance Raman spectroscopy. J. Pharmaceutical Sciences, 2008, 97, 2228-2241.
8. Cao, XL.; Wen, ZQ.; Vance, A.; Torraca, G. Raman microscopic applications in the biopharmaceutical industry: In-situ identification of foreign particulates inside glass containers with aqueous formulated solutions. Appl. Spectrosc. 2009, 63, 830-834.
9. Krishnan, S.; Cao, WJ.; Phillips, J. Appyling Raman spectroscopy to design of lyophilization cycles for protein formulation development. American Pharmaceutical Review. 2009, Sept/Oct, 44-53.
10. Xie, Y.; Cao, WJ.; Krishnan, S.; Lin, H.; Cauchon, N. Characterization of mannitol polymorphic forms in lyophilized protein formulations using a multivariate cureve resolution based Raman spectroscopic method. Pharm. Res., 2008, 25, 2292-2301.
11. Wen, ZQ; Torraca, G.; Yee. C.; Li, GY.; Investigation of contaminants in protein pharmaceuticals in pre-filled syringes by multiple micro-spectroscopies. American Pharm. Rev., 2007, 101-107.
12. de Veij, M.; Deneckere, A.; Vandenabeele, P.; de Kaste, D.; Moens, L.; Detection of counterfeit Viagra with Raman spectroscopy. J Pharm. Biomed. Anal. 2008, 46, 303-309.
13. Gosal, W.; Ross-Murphy SB.; Globular protein gelation, Curernt Opinion in Colloid & Interface Science, 2000, 5, 188- 194.
14. Mark, H.; Workman Jr., J.; Chemometrics in Spectroscopy. Academic Press, London, 2007.
15. Takeuchi, H.; Raman structural markers of tryptophan and histidine side chains in proteins. Biopolymers, 2003, 72, 305-317 16. Jehlicka, J.; Vitek. P.; Edwards, HGM.; Heagraves, M.; Capoun, T.; Application of portable Raman instruments for fast and non-destructive detection of minerals on outcrops, Spectrochimica Acta Part A: Molecular and Biomolecular Spectroscopy, 2009, 73, 410-419.
17. Akers, M. J.; Larrimore D. S.; Guozzo D. M.; Parenteral Quality Control, Informa, NewYork, 2007.
18. Eu, B.; Cairns, A.; Cao, XL; Wen, ZQ.; Direct visualization of protein adsorption to primary containers by gold nanoparticles. 2009, Submitted to J. Pharm. Sci.,
Dr. Xiaolin Cao is currently a senior scientist in Process & Product Development performing forensic analysis for Amgen’s manufacturing facilities. Before joining Amgen, Dr. Cao conducted research in the areas of vibrational Raman optical activity spectroscopy, vibrational circular dichroism, Raman and infrared spectroscopy for structural analysis of pharmaceutical molecules at BioTools Inc. He obtained his Ph.D. in analytical chemistry at the Australian National University. Dr. Cao’s current research is focused on the application of microspectroscopic Raman, FTIR, SEM, EDS, ROA and VCD for protein pharmaceutical analysis.
Dr. Zai-Qing Wen is a principal scientist in Process & Product Development at Amgen. He joined Amgen in 1999 and is the group leader for forensic analysis of manufactured formulated protein drug products in pre-filled syringes and glass vials using micro-spectroscopic techniques. His major research interest is the application of vibrational Raman and FTIR, and electronic and optical imaging techniques to characterize proteins and container materials and the interactions between them.
Joseph Phillips, Ph.D., is executive director in Process & Product Development at Amgen. In his current role he leads several functions engaged in protein formulation development, forensic analysis, product contact assessment, high resolution mass spectrometry, process & product ingredient characterization and process analytical technologies. He is a member of Amgen’s QbD advisory team. Readers may contact the author directly at: joseph@amgen.com