Introduction
Near-infrared spectroscopy (NIRS) is an analytical technique based on absorption measured in the near-infrared region of the electromagnetic spectrum that is between the visible and the mid-infrared regions. The fundamental absorption bands of functional groups occur in the mid-infrared and are very strong. The overtone absorptions of these fundamental bands occur in the near-infrared (NIR) spectral region and allow direct measurement without sample preparation due to the relative weakness of absorption. The OH, CH, NH and SH bonds have the strongest overtone absorbance in the NIR region. [1]
There has been considerable interest in the ability to test raw materials rapidly and nondestructively due to concerns of the European Union for better statistically-based sampling. Historically the “squareroot- of-N-plus-one” sampling of incoming raw material containers has been the accepted norm for raw material identification. There was no statistical basis for this sample plan but it conformed to what was practicable at the time it was implemented. NIRS can be used as a rapid analysis method to obtain identification data in seconds right on the loading dock. The European Union and Health Canada now require 100 % container sampling and identification. NIRS can meet this rigorous requirement and fits in well with the FDA initiative of process analytical technology (PAT) for better process understanding and monitoring [2]. Quarantine time can be reduced or eliminated for raw materials by reduced testing times. Identity testing is the most common NIR application.
Methods
 Figure 1 - The FOSS DS 2500 spectrophotometer
The NIR instrument used to collect spectra in this study was the DS-2500 near infrared spectrophotometer (FOSS NIRSystems, Laurel, MD) (see Figure 1). Spectra were collected in the reflectance mode from 400 nm to 2500 nm with 0.5 nm data intervals and 32 scans were co-added to produce a single spectrum.
Samples of the raw materials in sample cups were scanned in the data acquisition mode using the FOSS Vision® software. A minimum of three lots of each raw material should be scanned for each product to be added to a library. Libraries are composed of Products and each Product is composed of a set of at least three sample spectra which are representative of that product. A sample selection algorithm is provided in the Vision® software to detect spectral outliers.
The next step was to apply pattern recognition algorithms for identification. The correlation in wavelength space algorithm was used to discriminate the sugars. This algorithm provides a measure of spectral similarity. It is sensitive to peak positions - the overall pattern of the spectrum [3]. It is therefore more sensitive to peak shifts than to peak heights. This algorithm is most often used for Identification.
Results
Four similar raw materials were selected to demonstrate library discrimination: lactose anhydrous, USP direct tableting (dt) grade (Quest International, Hoffmann Estates, IL), lactose monohydrate 315 NF, (Foremost, Baraboo, WI), mannitol 2080 (SPI Polyols Inc. Wilmington, DE), and crystalline sorbitol NF (SPI Polyols Inc. Wilmington, DE). The raw, non-math-pretreated spectra of lactose anhydrous and lactose monohydrate are displayed in Figure 2. The second derivative of absorbance with respect to wavelength math pre-treatment was applied to baseline correct for scattering effects and to enhance spectral characteristics. See in Figure 3. Figure 4 shows the raw spectra of mannitol and sorbitol. Figure 5 shows the second derivative spectra of mannitol and sorbitol.
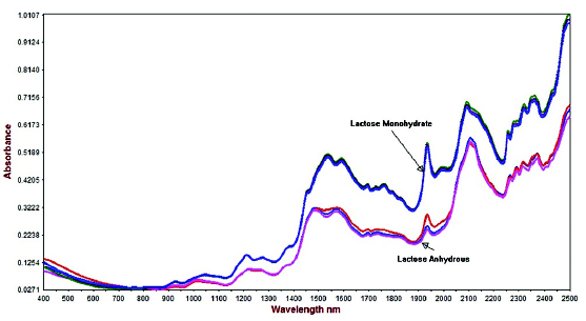 Figure 2 - Raw spectra (no math pretreatment) of lactose anhydrous and lactose monohydrate.
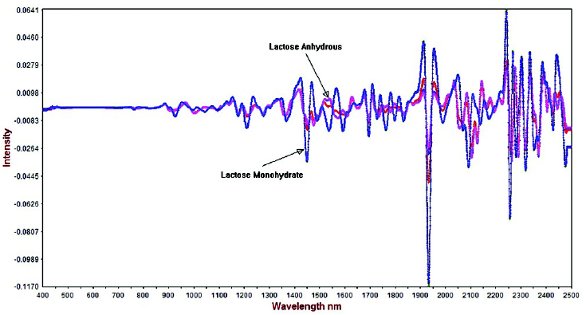 Figure 3 - Second derivative spectra of lactose anhydrous and lactose monohydrate.
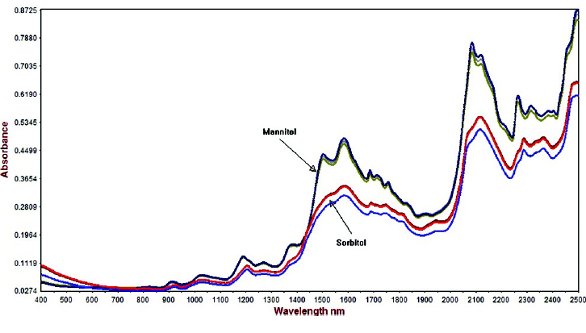 Figure 4 - Raw spectra (no math pretreatment) of mannitol and sorbitol.
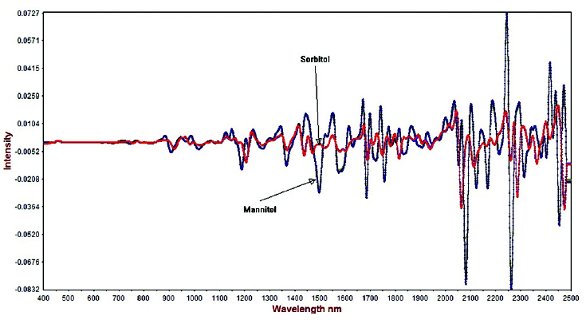 Figure 5 - Second derivative spectra of mannitol and sorbitol.
A global identification library method was created to discriminate the four products by correlation in wavelength space using the second derivative pre-treatment and a threshold criterion of 0.95. The library was internally validated using the Vision software. This validation process tests all library spectra and any outlier spectra to make sure that all acceptable spectra pass and all reject spectra fail. The program also tests that there are no ambiguous samples, that is, samples that are accepted in more than one product because they are not properly discriminated due to similarity.
Table I - Routine Analysis results for all sugars selected as “unknown”

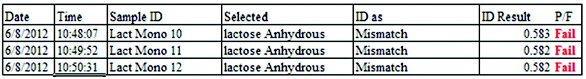
A routine analysis method was developed using the library containing the four products. Table I shows the results from the routine analysis method used to identify three samples from each product as an unknown. Table II shows the three samples of lactose monohydrate, sample Lact Mono 10, Lact Mono 11 and Lact Mono 12, that were re-analyzed as lactose anhydrous and they fail identification with a 0.58 correlation coefficient versus a threshold criterion of 0.95. Notice that they are identified as “mismatch”, indicating that the samples were detected as products in the library but not the material selected for analysis. The Vision software is 21 CFR part 11 compliant and all audit trail documentation is saved unalterably and electronically signed. The results report shows the time and date the sample was measured, the operator, the instrument serial number and the library used.
Table 2. Routine Analysis results for lactose monohydrate samples re-analyzed as lactose anhydrous.
Conclusion
This demonstration shows that near infrared spectroscopy provides a fast and accurate means of identifying raw materials that can be used for production and is in step with the FDA Process Analytical Technology (PAT) initiatives. NIR methods are fast, about 15 seconds per sample, and do not require sample preparation or the purchase and disposal of hazardous chemicals. NIRS can reduce laboratory workload and save labor costs by freeing up resources.
Robert Mattes has 18 years of experience in near-infrared technology and is presently an Applications Scientist at FOSS NIRSystems, Inc., Laurel, MD. He has taught the Near- Infrared Spectroscopy unit of the Hands-on Course in Tablet Technology at the University of Tennessee, Department of Pharmaceutical Sciences for ten years. His research interests include content uniformity analysis and real-time in situ process monitoring with near-infrared. He has provided chemometrics method development support for customers.
References
- R. Mattes, D. Root, Ed Brunson, Suresh Potharaju, Wen Qu, James Johnson, and Hassan Almoazen, “Near Infrared Analysis of Tablets Containing Two Active Ingredients”, Pharmaceutical Technology, November 2011, P. 52
- A. M. Afnan, “PAT: What’s in a name?” J. Process Analytical Technology, 1 (1) (2004).
- H. Mark, Handbook of Near-Infrared Analysis, D.A. Burns and E.W. Ciuczak, Eds. (Marcel Dekker, p. 394, 2nd ed., 2001).