Introduction
Portable Raman instruments have become important tools in the screening of raw materials and finished products [1-3]. An ongoing challenge that the Raman community faces is the issue of distributing spectral libraries and chemometric-based methods across different instruments [4]. The performance of a Raman spectral library or chemometric method created on one instrument can be unreliable when used on different instruments. This arises primarily from spectrometers that use different excitation wavelengths, but also slight differences in the optical components and detectors that are unique to each instrument. The greatest discrepancies are usually observed in comparing data acquired on instruments of different platforms (e.g., handheld vs. laboratory-based) and from different vendors, but we have also noticed considerable variability in the data taken on instruments from the same vendor and model [5]. Collectively, this points towards the need to develop and utilize calibration transfer schemes when distributing reference data or methods between different instruments. We will discuss our recent efforts to transfer spectral libraries and chemometric models across spectrometers using different calibration transfer approaches. The same calibration transfer scheme is not necessary for all types of methods. In general, spectral library methods, which compare test sample spectra to reference data in a library, are less sensitive to spectral response variations between instruments [6] and do not require the same rigorous calibration transfer algorithms that are needed to transfer chemometric methods [7] such as partial least squares (PLS).
Methods
To examine the spectral standardization requirements for librarybased spectral correlation methods, we developed a Raman spectral library on a 785 nm laboratory-based Raman spectrometer that includes 270 entries, including active pharmaceutical ingredients (APIs), excipients, and finished products. A 10 sample subset of this library was then acquired on four handheld (HH) 785 nm Raman spectrometers of the same model from the same vendor, to evaluate the performance of different transfer protocols.Library-based spectral correlation methods gauge similarity between spectra under comparison by a quantity known as the spectral correlation (SC) value. The SC value is equivalent to hit quality index (HQI), which is used extensively in literature [8] to rank spectral identifi cation (ID) results. The SC value in this study is computed by the spectral correlation coeffi cient algorithm, defined as:
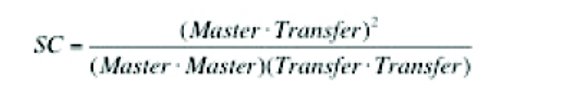
Eq. 1 where Transfer denotes the spectrum of the material acquired on the transfer spectrometer, Master denotes the spectrum of the material that is an entry in the master library, and the dot symbolizes the dot product of two spectral vectors. The SC calculation is performed using the Raman spectra that have undergone first derivative preprocessing [8]. The SC value ranges between 1.000 and 0, with the former indicating a perfect match, and the latter indicating the poorest possible match.
To evaluate the spectral standardization requirements for PLS methods, we developed a method on five 785 nm portable Raman (PR) spectrometers (different from those used in the spectral library portion above) to screen pharmaceutical grade glycerin for the presence of the adulterant diethylene glycol (DEG). The method development has been described in detail elsewhere [5], and is capable of predicting the concentrations of glycerin/DEG/and water in test samples. One of the five instruments was randomly selected as the master instrument, and the master instrument’s model was transferred to each of the remaining four transfer instruments using a 3 point window piecewise direct standardization (PDS) calibration transfer procedure.
Results
In our previous library transfer study fe, our test samples were constrained to excipients and APIs. In the present study, we use an augmented test sample set which includes finished products. The effect of the transfer protocols on the 10-sample test set of excipients, APIs, and finished products is shown in Table 1. When the spectra are uncorrected, the average SC values for all of the HH instruments fall in the ranges from 0.740 to 0.867, much lower [8] than what is traditionally considered a strong correlation. Three of the instruments have roughly similar values, with the remaining transfer instrument, HH-1, clearly being different from the others. The lower overall average SC value observed for HH-1 appears to be due mostly to a much lower average SC value for the finished products tested, although this instrument has lower SC values for the other two categories as well.
For this study we used two different transfer protocols:
- The 3-step method and
- The master library matching (MLM) method.
We have reported a detailed description of the 3-step method elsewhere [4], so only a brief description is provided here. For the 3-step approach, the shift and intensity axes are standardized to reference (or literature) values. A Raman shift standard sample [9], is used to correct deviations in the instrument vendor’s calibration as well as day-to-day frequency shifts that are commonly encountered with portable and handheld instruments. These deviations are usually small, in the range ~± 4 cm-1, but play an important role since we typically use first derivative preprocessing to reduce baseline effects [8]. A glass standard, such as NIST 2241 [10], is used to correct the relative intensity (y-axis) and a representative sample is used to establish the appropriate [4] convolution width of the master library to match the resolution of the transfer instrument.
Table 1. SC value results for 10 sample test set using no correction, 3-step method and master library matching method for library transfers.

The MLM correction, introduced for this paper, utilizes the same types of corrections, but approaches them from a different perspective. Whereas the 3-step method requires spectra acquired for both master and transfer instruments to align with literature or reference values, the MLM method takes the master library spectra and transforms them to match the transfer instrument’s spectral response. This makes it necessary to have a unique version of the master library for each spectrometer, but it obviates the need to correct test spectra prior to comparing them to library spectra. Like the 3-step approach, a Raman shift standard sample is also used in the MLM to perform the Raman shift correction, except the reference peak positions used are those from the transfer instrument instead of literature or reference values. The NIST 2241 luminescence glass standard is also used for the MLM approach, except instead of comparing the master instrument luminescence spectrum to a certified polynomial, the correction function is calculated by dividing the transfer instrument luminescence spectrum by the master instrument luminescence spectrum for each wavelength. Figure 1 shows the resulting correction function for each of the instruments used in this study based on using the A) 3-step method and B) the MLM method. In Figure 1A, the laboratory-based master instrument’s correction function is, as expected, noticeably different than the four handheld spectrometers, but perhaps more interesting is the variation of the spectral correction functions of the four HH units. The unique correction functions for each of these instruments clearly emphasize that instrument differences exist even when the spectrometers are the same model and vendor. While Figure 1A shows the correction function for each instrument, Figure 1B shows only the correction functions for the master instrument used to match each HH unit in the study. The correction function for the master instrument, determined by using the NIST 2241 glass standard methodfin, is shown in both Figure 1A and 1B to facilitate comparison. There is much less curvature in the correction functions shown in Figure 1B compared to those in Figure 1A, with the correction functions in the former exhibiting nearly linear trends below 1100 cm-1. The resolution matching procedure used in the MLM method is identical [4] to the one used for the 3-step method and is used to match the resolution of the master library to each transfer instrument.
As can be seen in Table 1, the average SC values improve for all four HH instruments when using both of these library transfer approaches. The greatest improvement observed is for HH-1, which had the lowest average SC value when performing no corrections to the spectra. The improvement stems mostly from a dramatic change in the average SC value of HH-1 for the finished products. The average SC value for HH-1 improves by nearly a factor of two when compared to the uncorrected results. Figure 2 shows the spectral evolution resulting from the transfer protocols on the Raman spectrum (panels A, C, and E) and first derivative spectrum (panels B, D, and F) for a levofl oxacin 500 mg tablet finished product acquired on HH-1 in comparison to the master library spectrum. The low SC value, 0.478, for the uncorrected data in Figure 2A,B is due primarily to differences in the peak positions and resolution mismatch between master and transfer spectrometer, most easily visible in Figure 2B. The first derivative preprocessing reduces some of the relative intensity mismatches between the master instrument and HH-1 by reducing baseline effects. The most surprising aspect of the 3-step correction data in Figure 2C,D is that the relative intensity correction does not improve the differences in either the Raman spectrum or first derivative Raman spectrum. This may be due to one of the inherent problems when using a certifi ed polynomial to correct for relative intensity. The certifi ed polynomial does not completely account for instrument-specifi c baseline effects. These intensity discrepancies are also apparent in the first derivative spectral comparison, shown in Figure 2D, even though the overall SC value is greatly improved to 0.817. As is visually evident by Figure 2E,F, the MLM method does the best job of matching the relative intensity profi les for the master and HH-1 transfer instrument, and the resulting SC value is 0.982. The relative intensity correction used in the MLM approach seems to account more completely for instrument-specifi c baselines than using a certifi ed polynomial. Both transfer methods seem to have comparable performances in the Raman shift and resolution corrections based on visual inspection. Despite improving the SC value for each of the HH instruments, the average SC values remain below or right around the 0.95 threshold. The only group that comfortably exceeds this threshold for all HH instruments is the finished products group when using the MLM method. This suggests that a 0.95 threshold may be too restrictive when transferring data acquired on high performance laboratory-based units with relatively low resolution portable/ HH spectrometers. The lower threshold values for the portable instrumentation may be due mostly to inherent fl uctuations and instabilities in the spectrometers’ performance, which leads to poorer signalto- noise for portable/HH units in comparison to laboratory-based units. This reduction in signal-to-noise can be alleviated, to a certain extent, by increasing the integration time and/or cooling the detector, but these instabilities remain one of the biggest considerations when developing methods and setting thresholds.
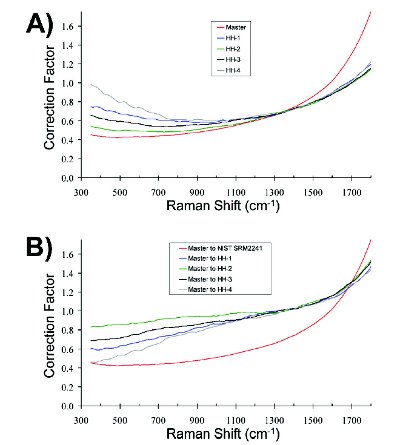
Figure 1. The correction functions used for relative intensity correction determined using A) the 3-step method and B) the MLM method.
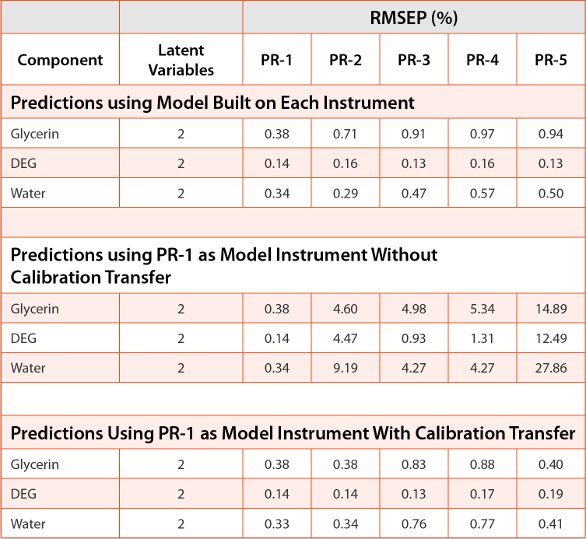
While the above calibration transfer approaches result in satisfactory transfer of library methods, they are not nearly as effective for transfer of chemometric-based methods. For methods such as PLS and soft independent modeling of class analogy (SIMCA) [5, 7], we have reported on the performance of direct and piecewise direct standardization (PDS) calibration transfer approaches. Table 2 shows the performance of a PDS approach for calibration transfer of a glycerin/DEG/water PLS model compared to models developed on each individual spectrometer and model transfer without spectral standardization as gauged using the RMSEP for a 13-sample test set. For the glycerin/DEG/water model built on each individual portable Raman (PR) instrument, PR-1 has the lowest RMSEP values. This makes PR-1 the obvious choice to act as the master instrument in the method transfer portion. When no calibration transfer schemes are utilized to transfer the PR-1 model to the other PR instruments, the RMSEP values for all three components increase dramatically across the four PR transfer instruments, meaning that the model would give incorrect results when running on these spectrometers. To test the effect of PDS, a total of five calibration transfer samples were selected from the training set using the Kennard- Stone ranking algorithm as detailed in our previous study [5]. The calibration sample set was constrained to samples with 0-15% DEG. A 13-sample test set was used to evaluate the effects of using PDS calibration transfer. When PDS with a three point window is used to transfer the model developed on PR-1, the RMSEP values fall much more in line with the individual models built on each instrument. Two of the instruments, PR-2 and PR-3, have RMSEP values that are closely aligned with the master instrument, PR-1.
Conclusion
The data presented here show that calibration transfer approaches can be used to reliably transfer spectral library and chemometric-based Raman methods between instruments. The implications of this are important, as it makes supporting a fleet of geographically distributed portable and handheld instruments possible. Rather than collecting a spectral library or building a chemometric method on each individual instrument, which may require acquisition of hundreds, or even thousands of samples on each unit, these approaches serve to streamline method development While the above calibration transfer approaches result in satisfactory transfer and transfer by limiting the library and method updating and maintenance requirements to only a master instrument.
Acknowledgments
The authors wish to thank Dr. Derya Cebeci Maltaş for assistance with the ongoing spectroscopic library building effort. This project was supported in part by the CDER Critical Path Program and FDA Medical Countermeasures Initiative (MCMi).
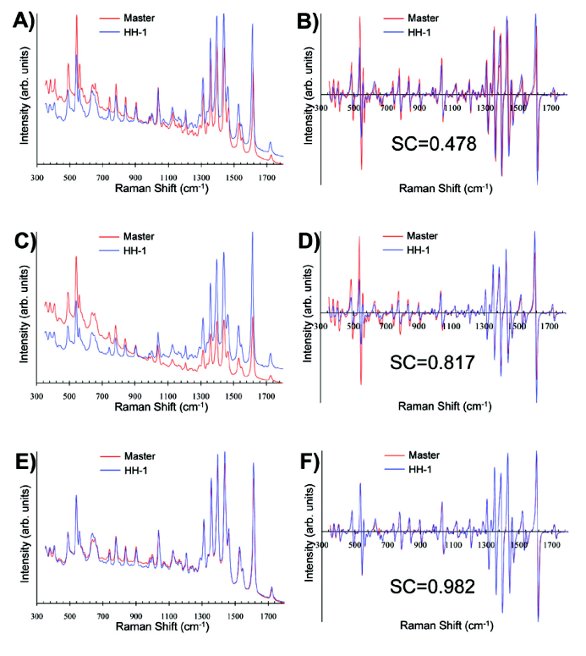
Figure 2. The eff ect of library transfer methods for levofl oxacin 500 mg finished product sample: A) uncorrected Raman spectra, B) uncorrected first derivative spectra, C) 3-step method corrected Raman spectra, D) 3-step method corrected first derivative spectra, E) MLM corrected Raman spectra, and F) MLM corrected first derivative spectra.
Table 2. Effect of calibration transfer of glycerin/DEG/water model across five portable units.
Disclaimer
The findings and conclusions in this article have not been formally disseminated by the Food and Drug Administration and should not be construed to represent any Agency determination or policy.
Author Biographies
Jason D. Rodriguez, Ph.D., is a chemist in the FDA Division of Pharmaceutical Analysis, St. Louis, MO. He received his Ph.D. from the University of Illinois at Urbana- Champaign in 2009 and his B.S. in chemistry from the University of Texas Pan American in 2004. He joined the FDA/DPA in 2009 and has worked on developing fielddeployable Raman and near infrared spectral library methods.
Connie Gryniewicz-Ruzicka, Ph.D., is a chemist in the FDA Division of Pharmaceutical Analysis, St. Louis, MO. She has a B.A. in chemistry from Wayne State University and received her Ph.D. in Analytical Chemistry from the University of Missouri-Rolla. She currently utilizes spectroscopic and chemometric methods to study the authentication and quality of pharmaceutical products.
John F. Kauffman, Ph.D., is a research chemist at the FDA Division of Pharmaceutical Analysis. He earned a Ph.D. in Physical Chemistry from the University of Illinois in 1988. He joined the FDA in 2004 to develop NIR and Raman spectroscopy for pharmaceutical analysis. Prior to joining FDA, he was professor of chemistry at the University of Missouri.
Sergey Arzhantsev, Ph.D., is senior staff fellow at the FDA Division of Pharmaceutical Analysis. He received a Ph.D. in Physics from Moscow M. V. Lomonosov State University in Moscow, Russia. Dr. Arzhantsev utilizes spectroscopic methods to study the quality and stability of pharmaceutical products.
Allison L. Saettele was a summer intern at the Division of Pharmaceutical Analysis during the summer of 2012. She is currently a student at the University of Missouri- St. Louis.
Katherine A. Berry was a summer intern at the Division of Pharmaceutical Analysis during the summer of 2012. She is currently attending the University of Arizona where she is a pre-pharmacy student.
Benjamin J. Westenberger is Deputy Director of the Division of Pharmaceutical Analysis (DPA) in St. Louis, a laboratory for the Center for Drug Evaluation and Research (CDER) in the Food and Drug Administration (FDA). Mr. Westenberger joined DPA in 1971, and has held a variety of positions during his tenure at the DPA.
Lucinda F. Buhse, Ph.D., is Director of the Division of Pharmaceutical Analysis, a laboratory based division in CDER responsible for supporting FDA review, investigation and enforcement actions and for conducting research programs to advance new technologies to assess pharmaceutical quality. Dr. Buhse received a Ph.D. in Physical Chemistry from the University of California, Berkeley.
References
- Carron K., Cox R., “Qualitative analysis and the answer box: a perspective on portable Raman spectroscopy”, Anal. Chem. (2010), 82, 3419-3425.
- Green R. L., Brush R., Jalenak W., Brown C. D., “Verification Methods for 198 Common Raw Materials Using a Handheld Raman Spectrometer”, Pharm. Technol. (2009), 33, 72-82.
- Mecker L. C., Tyner K. M., Kauffman J. F., Arzhantsev S., Mans D. J., Gryniewicz-Ruzicka C. M., “Selective melamine detection in multiple sample matrices with a portable Raman instrument using surface enhanced Raman spectroscopy-active gold nanoparticles”, Analytica Chimica Acta (2012), 733, 48-55.
- Rodriguez J. D., Westenberger B. J., Buhse L. F., Kauffman J. F., “Standardization of Raman spectra for transfer of spectral libraries across different instruments”, Analyst (2011), 136, 4232-4240.
- Gryniewicz-Ruzicka C. M., Arzhantsev S., Pelster L. N., Westenberger B. J., Buhse L. F., Kauffman J. F., “Multivariate Calibration and Instrument Standardization for the Rapid Detection of Diethylene Glycol in Glycerin by Raman Spectroscopy “, Appl. Spectrosc. (2011), 65, 334-341.
- Rodriguez J. D., Westenberger B. J., Buhse L. F., Kauffman J. F., “Quantitative Evaluation of the Sensitivity of Library- Based Raman Spectral Correlation Methods”, Anal. Chem. (2011), 83, 4061-4067.
- Gryniewicz-Ruzicka C. M., Rodriguez J. D., Arzhantsev S., Buhse L. F., Kauffman J. F., “Libraries, classifiers, and quantifiers: A comparison of chemometric methods for the analysis of Raman spectra of contaminated pharmaceutical materials”, Journal of Pharmaceutical and Biomedical Analysis (2012), 61, 191-198.
- Kauffman J. F., Rodriguez J. D., Buhse L. F., “Spectral Preprocessing for Raman Searches”, Am. Pharm. Review (2011), 14, 34-40.
- McCreery R. L. 2001. Raman Spectroscopy for Chemical Analysis. ed.: John Wiley & Sons, Inc. p 420.
- Etz E. S., Choquette S. J., Hurst W. S., “Development and Certification of NIST Standard Reference Materials for Relative Raman Intensity Calibration”, Microchim. Acta (2005), 149, 175-184.
- Choquette S. J., Etz E. S., Hurst W. S., Blackburn D. H., Leigh S. D., “Relative Intensity Correction of Raman Spectrometers: NIST SRMs 2241 Through 2243 for 785 nm, 532 nm, and 488 nm/514.5 nm Excitation”, Appl. Spectrosc. (2007), 61, 117-129.