What team would not want to be level loaded, have low schedule variability, and high levels of continuous improvement? These are gains of standard work.
Introduction
Once the decision was made to deploy standard work in the QC Microbiology lab, a three day workshop that included members of the team, team leads and managers, and the Operational Excellence team was scheduled as a kick-off for the implementation. As our team had gone through other lean lab deployments, there were questions about how this would be any different and what standard work really meant. We used this time to have these discussions and get buy in from the team, as well as learn the tools for a successful deployment.
So what is standard work and why would we need it? Simply put, it is the current best known way to perform a task, and continuously improve it. Standard work is a way to manage the process and identify needed improvements. Standard work is not meant to manage the people! There were three key pieces that led to our standard work success: team culture, good tools, and the continuous improvement (CI) loop.
Standard Work Tools – Team Culture
We are a small, cross-functional lab with eight dedicated testing analysts routinely performing 20 assays; we have a high volume of samples. We knew that we needed a way to manage and streamline the process, while maintaining quality. Standard work helps the team identify variances in the work and make improvements, and reduce do-overs, investigations, and unplanned work.
The cultural influencing is the biggest challenge. You are asking people to do quite a bit of work before they can completely see the value. For example, asking them to measure themselves, fill out role cards, and openly discuss errors and mistakes. This takes a lot of commitment and discipline from the team. We were able to get the team engaged, excited, and prepared during the workshop. Due to testing requirements and lab activities all colleagues could not participate in the workshop, however, those that were present prepared daily report outs to the team to help spread the interest and enthusiasm to those unable to attend the all day events.
It cannot be stressed enough that standard work is a grassroots effort. The implementation truly has to come from the team, those doing the work. As we moved further into the implementation, team leads, managers, and I, the project manager, began to have less influence on the group. This is exactly what you would want to see happening. The team begins to feel empowered, and own their work as they see their ideas being executed and the process really start to work for them. In our case, this started to happen after about two months into the implementation of standard work.
Standard Work Tools – Role Cards
Wouldn’t it be great if all of life’s jobs came with the current best known way to perform the task? That is what the role cards provide to the testing analysts. They are meant to be a map for the analyst, not a replacement for the procedure. The role cards are used to establish the standard time for assays, while determining variances in the work. Although time is the indicator, the best known way is not necessarily the fastest way, but the way that delivers the best results with the best quality. The role cards were created by the team. We broke into small groups, process mapped the assays, and proposed standard times for the assay steps.
Below is an example of a role card used in our lab.

When we first started, the proposed standard times were input into the “time” columns on the left; however, we removed the standard times from the role cards. We did this in hopes to gather more accurate data. What we were finding was that when the standard time was visible, that the standard time and the actual time would be the same. The feedback from the team was that there was a lot of pressure to perform the assays in a certain time. Once the standard time was removed, not only did we get an accurate baseline, but we began to see the variance from test session to test session, as analysts were giving a lot of comments because they were not sure if they were an outlier. All of the information gathered from the role cards were placed into the CI loop and discussed at the continuous improvement meeting, including best practice and efficiencies.
The role cards were hard for the analysts to get excited about until the value started to show. One common issue that we were able to fix immediately was the amount of interruptions due to phone calls in to the lab. There was a mobile phone in the lab, which we gave to the leads to keep throughout the day to minimize interruptions to testing. This was a major “ah-hah” moment for the lab, as this was the first time that they saw the value in vetting the role cards. Moving forward we were able to get valuable information and stabilize the assays.
Standard Work Tools – Scheduling
Prior to standard work, one lead would create the weekly schedule for each analyst, spending about four hours per week doing so. This schedule was electronically housed, meaning you had to be at a computer to see it, and it was cumbersome to maintain. The role cards were an essential piece of the scheduling puzzle. Once we were able to determine how long assays were taking, we were able to create larger roles that encompassed several of the individual assays. Once the larger roles were created, it was decided that the lab would rotate these roles monthly to maintain proficiency and fairness.
Below is our current scheduling board.
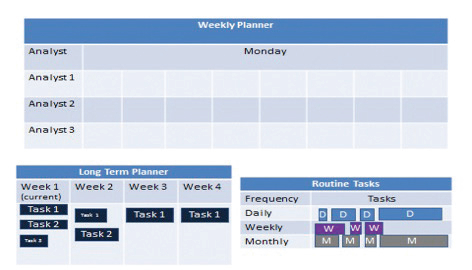
The current weekly planner is a magnetic board outside of the lab that was created as a visual management tool that enabled anyone to quickly determine the lab activities. The top graph represents all of the analysts and each day of the week. The bottom right graph houses all of the routine tasks that must be completed and by what frequency, with the tabs representing the time it takes to complete the task. The bottom left graph represents the long term planner, a four week look ahead so that the lab is better able to plan work that may or may not be routine. Examples of tasks that may end up on the long term planner are instrument maintenance or special sampling. The analysts are assigned roles, however, they self-schedule their week starting with the routine tasks, then the pulling from the long term planner. The last part of the scheduling is continuous improvement, as that time is now built in through roles and level loading of the work.
Standard Work Tools – Continuous Improvement
Continuous improvement ideas have always been generated by our team; we just did not have a robust process to ensure 1) CI ideas were visible and discussed 2) that time was scheduled to work on the ideas being produced. Prior to the implementation of standard work, CI cards were placed at a central location, far from the lab, and typically, were not discussed. With the implementation of standard work, we had hourly meetings where role cards were vetted and CI ideas were prioritized.
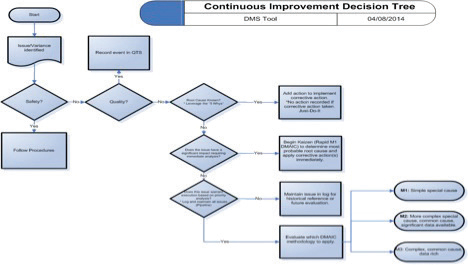
CI ideas are run through the above decision tree to determine whether it is an M1, M2, or M3 project.
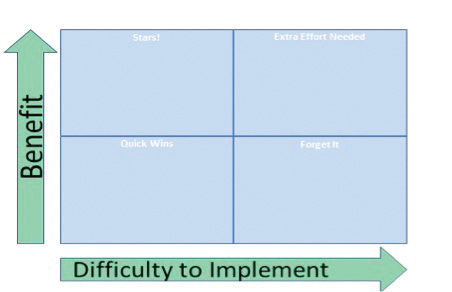
Projects are then prioritized based on benefit versus the difficulty to implement and placed in the appropriate location on the prioritization matrix, making them visible for the team. One benefit to this process is that ideas are implemented in a timely manner. Another benefit is that the entire team is part of the discussion; therefore the team owns the outcome and can see the ideas being valued. As members have time in their schedule, they choose projects that have been placed on the prioritization matrix. The analysts determine the due date and progress is discussed during the weekly CI meetings.
How Do We Know That It Is Working?
When we first implemented standard work, we set goals in order to determine if the process was working. We decided on two goals over a six month period: an average 30% reduction in the nine most frequently performed assays and two CI ideas implemented per week. The implemented CI ideas do not have to be time consuming or weighty projects, they only have to be ideas implemented that improve the process.
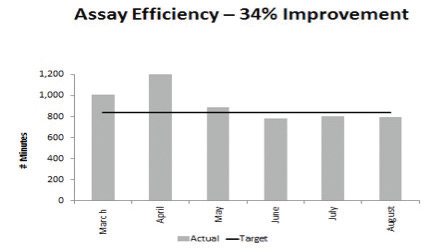
We began with a total of 1,194 minutes in touch time for nine assays. In six months those same assay touch times were reduced to 795 minutes.
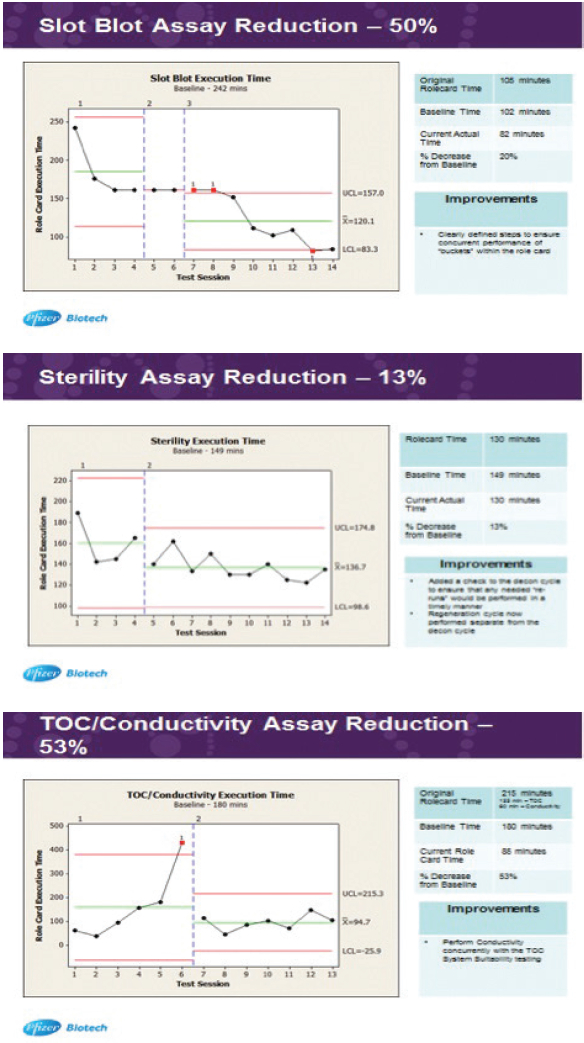
Below are three examples of assay efficiency gains, and the improvements made to achieve those improvements.
Conclusion
We not only met our goals, but actually exceeded what we originally thought was possible. One of the most important outcomes is that our team truly owns their work. The team is comfortable expressing concerns and is empowered to push back when the process is being interrupted.
- 34% reduction in assay touch time
- ~2,500 hours saved, also includes CI projects implemented
- 175 hours saved per year in scheduling
- Continuous Improvement
- Built in CI time
- Ideas identified and are prioritized
- 78 projects completed in 6 months
- 43 completed the previous year
- Highly engaged team, owning their work
Acknowledgements
The author would like to thank Rebecca Clark and the entire Pfizer Sanford QC Microbiology team, as well as Dorothy Kellam, Doug Smith, and Sarah Blech.
Author Biography
Leslie Falco is currently a Quality Control Microbiology Scientist at the Pfizer, Sanford, NC facility. Leslie has worked in the pharmaceutical microbiology laboratory since 2005, after working in a genetic testing laboratory at Duke University. She holds a Bachelor of Science in Microbiology from NC State University.