Introduction
One of the most common product safety related analytical tests is the quantification of inorganic impurities within a pharmaceutical product. This includes toxic heavy metals, such as As, Cd, Hg, and Pb. Other metals, such as Fe, Cr, Ni and Zn, are also of interest due to health risks. In addition, many Active Pharmaceutical Ingredients (APIs) may contain residual metal catalysts, such as Ru, Pt, and Pd. Since there are many potential sources of contamination, it may be of interest to measure raw materials, intermediates as well as final products. This study demonstrates that the X-ray Fluorescence (XRF) technique is capable of performing elemental analysis of all of these pharmaceutical (liquid, powder and solid) materials with high sensitivity, precision and accuracy. Simple sample preparation, non-destructive analysis, a wide dynamic range and good to excellent detection limits across large parts of the periodic table are some of the advantages of this method.
X-ray Fluorescence (XRF) spectrometry
XRF (X-ray fluorescence spectrometry) is a non-destructive analytical technique used to identify and determine the concentrations of elements present in solid, powdered and liquid samples. XRF is capable of measuring elements from beryllium (Be) to uranium (U) and beyond at trace levels often below one part per million and up to 100%. The XRF spectrometer measures the individual component wavelengths of the fluorescent emission produced by a sample when irradiated with X-rays.

XRF instrumentation is conventionally divided into Wavelength Dispersive (WDXRF) and Energy Dispersive (EDXRF) instruments, the distinguishing factor being the technologies used for the energy discrimination and detection of the X-ray photons. WDXRF instrumentation typically has much higher power loading on the sample than EDXRF. This may limit the use of the WDXRF technique (typically with power in kW range) for organic matrix sample analysis because the heat generated by the X-rays may be sufficient enough to induce sample alteration, such as browning or discoloring of the sample surface or loss of volatile elements (e.g. Hg and Se). EDXRF systems, on the other hand, use low power X-ray sources or secondary targets and will not significantly heat the sample. As the bulk of pharmaceutical materials are organic in nature the focus of this white paper is to emphasize the usefulness of the EDXRF technique, which has the best potential for the measurement of all elements from Na - U in pharmacological-type samples.
The detector system in EDXRF determines the energy of the X-ray photons and accumulates the data in a multichannel analyzer. The resulting spectrum is used in subsequent steps to extract information regarding the elemental composition of the specimen. Essentially, EDXRF is a simultaneous technique as it accumulates information about all elements in the sample at the same time. The performance can be significantly boosted by optimizing the excitation conditions for the elemental ranges of interest. Two or more spectra (each obtained with different measurement conditions) are then obtained. Calibration procedures for quantification are carried out through normal spectroscopic techniques involving the measurement of standards of varying elemental concentrations. Blanks may be included but these are not essential. XRF calibrations have the advantage over other elemental analysis methods, such as Inductively Coupled Plasma (ICP) or Atomic Absorption (AA) spectroscopy, of being long lasting, often more than a year before any recalibration is required.
Sample Preparation
Liquid samples, powders and solids can be analyzed by XRF without sample alteration, except perhaps cutting it to a size that is compatible with the sample holders. Sample weights can vary from mg quantities to several grams. Larger sample masses are often used to minimize sampling errors.
Liquid samples
Liquid samples are poured in special sample cups, equipped with a supporting film. This film should be transparent to X-rays, chemically inert and free of contamination. Typical films are made from polyester or polypropylene and have thicknesses varying from 1.5 micrometers to 13 micrometers. The thinner films have higher transparency to X-rays (leading to higher intensities); the thicker films are more robust. These cells can also be used to analyze loose powders. Organic matrices (such as many pharmaceutical materials) exhibit relatively low X-ray absorption. To ensure that the X-ray intensities are determined only by the composition of the specimen and independent from the absolute mass, it is recommended to fill these cells to at least 1.5 cm in depth.
Powder and solid samples
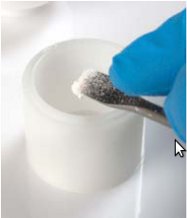
Loose powder samples may be placed directly into a disposable sample cup. Coarse powders must be ground to a fine particle size. Powders can also be pressed into a solid pellet. This generally requires the addition of some binder. The resulting pellets can be analyzed without supporting film, and can also be analyzed in vacuum. The amount of binder added rarely exceeds 10% of sample mass, so the effect of the dilution is minimal. Advantages of pressing a sample are increased repeatability due to constant volume, enhanced light element reproducibility because air voids are removed which can absorb X-rays and the possibility to directly measure a pressed pellet without a supporting film resulting in greater sensitivity. In addition pelleted samples can be measured in vacuum conditions and thus reduce any photon absorption by air or any other gas such as He. Some materials such as lactose or cellulose do not require the addition of a binder, while other powders may require the addition of a suitable binder material, such as wax. All non-homogenous solid samples such as coated tablets should be ground by means of mortar and pestle or a grinding device, such as a mill.
Calibration and Measurement Method Development
Optimal measurement conditions are determined for each element of interest, and measurement times are selected to obtain an acceptable counting-statistical-error (CSE) for each element of interest, so that the required analytical precision can be achieved. The calibration is done by determining for each analyte the relationship between measured intensities and certified concentration for a number of standard samples. In practice it is common to optimize for a group of elements using a single condition to improve method efficiency.
Matrix correction
In XRF either undiluted samples or samples with a low dilution are measured. This results in matrix effects: the presence of one element that influences the measured intensity of the others. At elevated levels one element might (through processes such as absorption or enhancement) affect the intensity of another significantly. These matrix effects are well understood in XRF, and several methods have been developed to deal with them. The European Pharmacopeia1 lists the use of the Compton method to correct for matrix effects when analyzing trace levels. The Compton correction method is a straight-forward and effective method for such applications. It consists of taking the ratio of the measured intensity of the analyte and the intensity of a scattered line which is representative of the excitation. This scattered line is a characteristic line from either the X-ray tube of from the secondary target used. The Compton correction method corrects for matrix effects, and also to some extent for variations in sample packing when loose powders are analyzed.
Drift correction
The intensity of an X-ray instrument gradually deteriorates with time in a rather predictable fashion. Measuring this change in intensity with time allows for the determination of a drift factor, which can be applied to the calibration curves to keep them accurate over long periods of time. Most manufacturers provide drift correction routines with the software. High-end X-ray instrumentation, with specifically designed tubes is very reliable and stable; in some cases the drift needs only to be corrected for once a month. The calibration curves can be used for much longer periods of time.
Experiment
This white paper focuses on the analysis of excipient materials doped with known concentrations of metals. Standard samples were produced using fine excipient grade cellulose and pure organo-metallic compounds. ICP-MS techniques were employed to independently confirm the concentrations of elements in each standard. These standards were prepared and measured as both loose powders and pressed pellets. All loose powder standards and samples were weighed into disposable sample cups with 4.2 micrometer polypropylene support film. Compton ratio corrections were employed to account for any minor variations in sample packing. All pressed pellets were produced without a binder and pressed for 60 seconds at 10 tons.
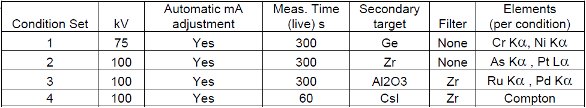
These materials (standards) were used to set up calibrations on a PANalytical Epsilon 5 EDXRF instrument. The Epsilon 5 instrument employs a tunable excitation strategy which includes multiple secondary targets and the ability to generate 100 KeV excitation. In addition it has a polarized optical path which results in low backgrounds. Both loose-powder and pressed-powder (pellets) have been analyzed using the measurement conditions listed below. Loose-powders were measured under a helium atmosphere while the pellets were measured under vacuum. All elements were measured using measurement conditions described in Table 1 for 300 seconds (5 minutes) live time (the detector active-time). A maximum dead time of 50% was employed translating to an approximate average 8 minute measurement per measurement condition.
Table 1. Measurement Conditions Employed for Cellulose Loose Powders and Pressed Pellets.
Calibration curves for a selection of trace elements in a cellulose-based matrix are given in Figures 1-10. These graphs clearly demonstrate the linear response capability of the EDXRF technique. Both loose powder (left graphs) and pressed pellet (right graphs) calibrations are presented for direct comparison.
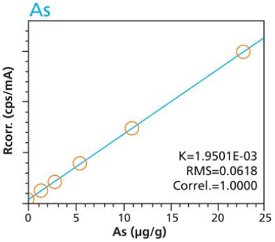 Figure 1. As calibration – Loose Powder (5g) Cellulose Standards
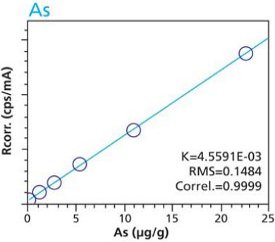 Figure 2. As calibration – Pressed Pellets (5g) Cellulose Standards
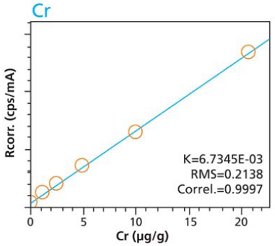 Figure 3. Cr calibration – Loose Powder (5g) Cellulose Standards
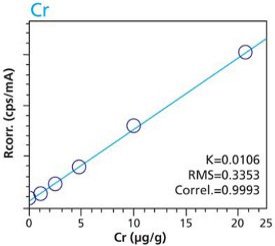 Figure 4. Cr calibration – Pressed Pellets (5g) Cellulose Standards
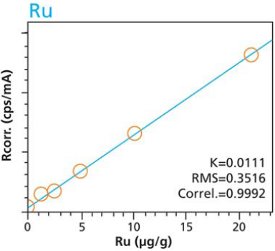 Figure 5. Ru calibration – Loose Powder (5g) Cellulose Standards
 Figure 6. Ru calibration – Pressed Pellets (5g) Cellulose Standards
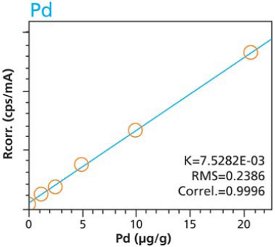 Figure 7. Pd calibration – Loose Powder (5g) Cellulose Standards
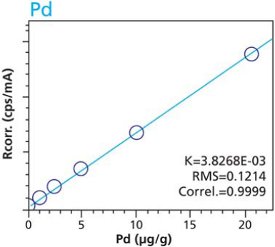 Figure 8. Pd calibration – Pressed Pellets (5g) Cellulose Standards
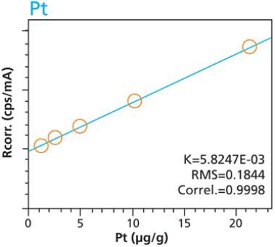 Figure 9. Pt calibration – Loose Powder (5g) Cellulose Standards
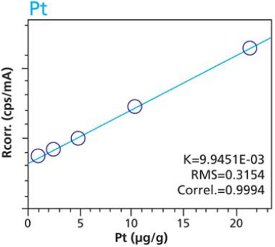 Figure 10. Pt calibration – Pressed Pellets (5g) Cellulose Standards
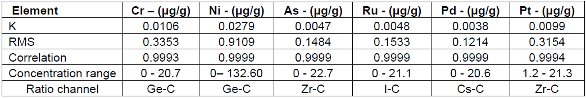
Tables 2 and 3 summarize the calibration data of the loose powder cellulose and pressed pellet cellulose methods. The root-mean-square (RMS) is calculated from the differences between the certified values of the standards, and the values as calculated from the calibration curve. The K value is calculated in essentially the same way as the RMS, but each residual value is weighted by the square root of the concentration. This value is less sensitive to the actual concentration range. The correlation and relative errors for each curve are also presented. The slope of the calibration curve is calculated in units of concentration over intensity. The Ratio Channel identifies which secondary target Compton line is used to correct for differing matrix effects.
Table 2. Calibration Data 5 g Pressed Pellet

Table 3. Calibration Data 5 g Loose Powder
Additional Excipient Materials
An additional set of organic materials (rice- and wheat-flour powders) were doped with a different set of heavy-metals using the same technique described. As seen with the cellulose excipient examples, the calibration curves demonstrate a strong correlation between measured intensity and concentration. Furthermore these examples demonstrate the possibility of including different materials types. The calibration lines do not intersect the origin because natural plant excipients already contain some of the elements of interest. Figures 11 – 18 are calibration curves of Fe, Cd, Pb and Mn. Note that the first and second graph of each element represent similar excitation conditions and demonstrate differences between using 10 minute and 2 hour measurement times. Only minor improvements in RMS and Correlation are noticeable for Mn and Fe. However, both Cd and Pb demonstrate improvements with increasing measurement time.
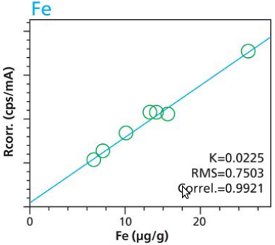 Figure 11. Fe calibration (10 minute per condition) Rice and Flour Standard Materials
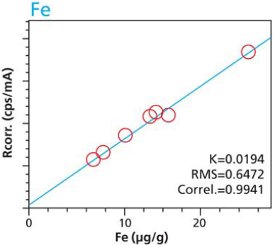 Figure 12. Fe calibration (2 hour per condition) Rice and Flour Standard Materials
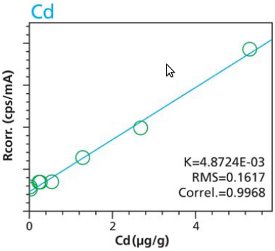 Figure 13. Cd calibration (10 minute per condition) Rice and Flour Standard Materials
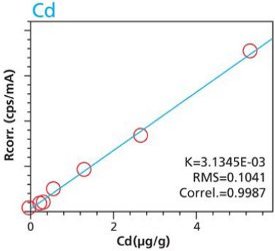 Figure 14. Cd calibration (2 hour per condition) Rice and Flour Standard Materials
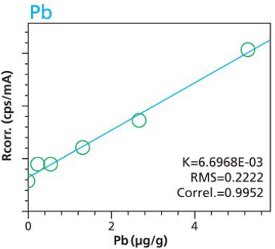 Figure 15. Pb calibration (10 minute per condition) Rice and Flour Standard Materials
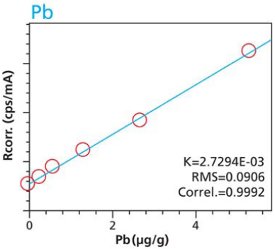 Figure 16. Pb calibration (2 hour per condition) Rice and Flour Standard Materials
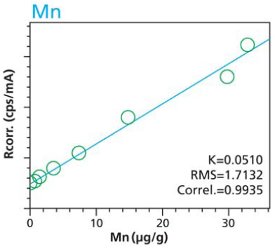 Figure 17. Mn calibration (10 minute per condition) Rice and Flour Standard Materials
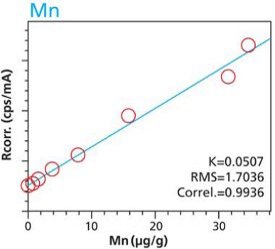 Figure 18. Mn calibration (2 hour per condition) Rice and Flour Standard Materials
Repeatability and Robustness
Tables 4, 5 and 6 demonstrate the repeatability of the EDXRF technique using a cellulose standard. Loose powder masses of 5g and 2.8g and a 5g pressed pellet are listed for comparison.
Table 4. Loose Powder Cellulose Standard #3 (5g)
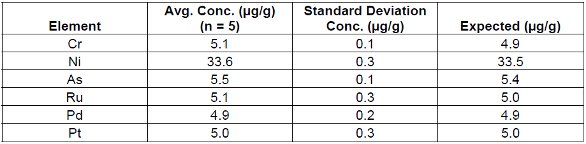
Table 5. Loose Powder Cellulose Standard #3 (2.8g)
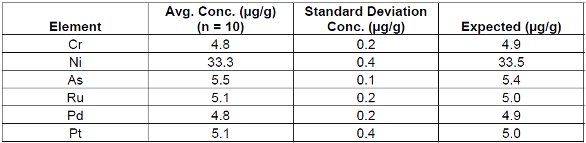
Table 6. Pressed Pellet Cellulose Standard #3 (5g)
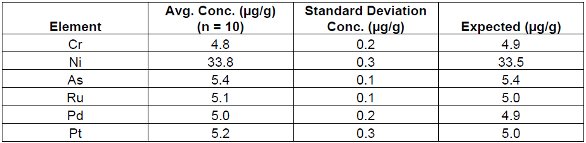
These results demonstrate the robust nature of the technique in accommodating loose powder and pressed pellet methods. Furthermore it should be noted that the reduced weight (2.8 g) standard sample was measured using the loose powder method where larger weights (5g) were previously employed. This demonstrates that varying sample thicknesses/masses can be easily corrected using the Compton ratio method. From these results it is evident that regardless of the sample preparation technique EDXRF performed equally in all cases.
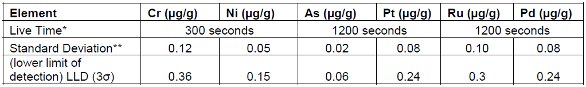
Detection Limits
Tables 7 and 8 demonstrate lower limits of detection (LLD) for both cellulose and lactose excipients. Although both materials may be structurally and chemically different there is a high degree of similarity with regards to the performance of the metal analysis. It is important to note that in most cases increasing measurement time will improve the lower limit of detection. This relationship is well described in the literature2,3 and it is widely accepted that detection limits will be lowered by a square-root-function of increasing times (e.g. a 4 fold increase in measurement time will lower the LLD approximately 2 fold). This is true as long as counting statistical error dominates over the errors directly associated with sample preparation techniques and/or the instrument.
Table 7. Detection and Reporting Limits using Natural Wood Cellulose excipient**
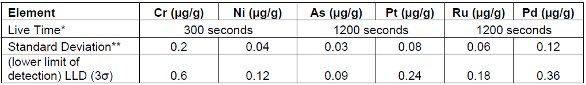
* Live Time is the electronic counting time. Measurement As/Pt and Ru/Pd times were extended to achieve lower detection limits.
** Standard deviations were calculated after 10 repeat measurements using blank materials.
Table 8. Detection and Reporting Limits using Lactose excipient
* Live Time is the electronic counting time. Measurement As/Pt and Ru/Pd times were extended to achieve lower detection limits.
** Standard deviations were calculated after 10 repeat measurements using blank materials
Using similar techniques, E. Margui et al reported lower detection limits for Pd catalyst residues in active pharmaceutical ingredients by EDXRF.4 Realistic reporting limits are a factor 3 times higher than LLD.
Small Mass Samples (100 mg)
With the understanding that new materials, particularly active-pharmaceutical- ingredients (API’s), are often not abundant and/or are expensive the preceding activities were repeated to test the possibility of using small mass samples (i.e. 100 mg). Cellulose standards and samples were simply weighed (to 3 decimals) into disposable cups. Duplicate samples were used to demonstrate the reproducibility of sample preparation. This time the method used only two conditions to highlight 4 critical elements. Figures19 – 22 are calibration curves for As, Pt, Ru and Pd. Similar to larger mass calibrations (Figures 1 – 10) each element calibration curve demonstrate a high degree of linearity and correlation. Furthermore, the closeness of fit of the duplicate samples proves the reproducibility of sample preparation.
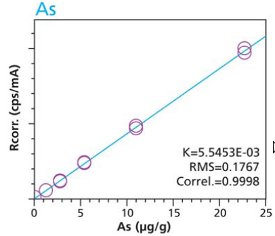 Figure 19. As calibration – Loose powder (100 mg) Cellulose Standards in Duplicate
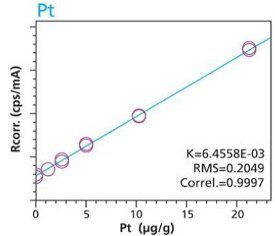 Figure 20. Pt Calibration – Loose Powder (100 mg) Cellulose Standards in duplicate
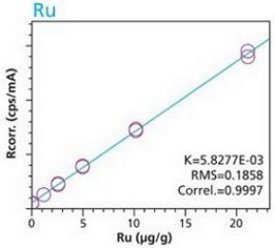 Figure 21. Ru calibration – Loose powder (100 mg) Cellulose Standards in Duplicate
 Figure 22. Pd Calibration – Loose Powder (100 mg) Cellulose Standards in duplicate Table 9 demonstrates lower limits of detection (LLD) for cellulose excipients. These values are similar to those previously described for larger mass samples (Tables 7 - 8).
Table 9. Detection and Reporting Limits using Cellulose excipient
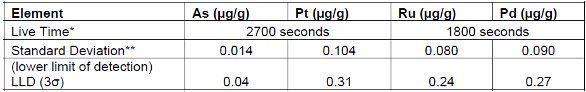
* Live Time is the electronic counting time. Measurement As/Pt and Ru/Pd times were extended to achieve lower detection limits.
** Standard deviations were calculated after 10 repeat measurements using blank materials
Conclusions
The EDXRF technique is a robust, precise, sensitive and accurate method with the potential to analyze inorganic impurities in many types of pharmaceutical materials. The analysis of the elements Al, Sb, As, Cd, Cr, Co, Cu, In, Ir, Fe, Hg, Pb, Mg, Mn, Hg, Mo, Ni, Os, Pd, Pt, Rh, Ru, Ru, Se, Sr, Tl, Sn, W and Zn are all feasible by EDXRF. The EDXRF technique is capable of generating reporting limits that comply with current and proposed pharmacopeia limits for these metals.
The simplified sample preparation technique which include direct liquid analysis without the concern of salt concentrations or acidity levels, direct loose powder or press pellet analysis, presents a great advantage over other analytical techniques. This represents a significant simplification in the analysis of pharmaceutical materials.
References
- European Pharmacopoeia, section 2.2.37; X-Ray Fluorescence Spectrometry (2008).
- Understanding XRF Spectrometry, by James Willis and Andy Duncan, a two part text book available through PANalytical
- Van Grieken, Markowicz (eds.), Handbook of X-ray Spectrometry, 2nd edition Marcel Dekker, NY, NY. ISBN 0-8247-0600-5
- Analytical Chemistry 2009, 81, 1404-1410, Method for the Determination of Pd-catalyst Residues in Active Pharmaceutical Ingredients by Means of High-Energy Polarized Beam Energy Dispersive X-ray Fluorescence, E. Marui, K. Van Meel, R. Van Grieken, A. Buendia, C. Fontas,M. Hidalgo, I. Queralt.