Claudia Corredor - Engineering Technologies, Drug Product Development, Bristol-Myers Squibb Company, New Brunswick, NJ
Stephanie A Ketcham - Manufacturing Sciences and Technology: BioProcess Technology, Global Product Development and Supply, Bristol-Myers Squibb Company, Devens, MA
Kyle McHugh - Biologics Process Development, Bristol‐Myers Squibb Company, Devens, MA
Gregory Lane - Engineering Technologies, Drug Product Development, Bristol-Myers Squibb Company, New Brunswick, NJ
Nobel Vale - Engineering Technologies, Drug Product Development, Bristol-Myers Squibb Company, New Brunswick, NJ
Matthew Rehmann - Biologics Process Development, Bristol‐Myers Squibb Company, Devens, MA
Douglas Both - Engineering Technologies, Drug Product Development, Bristol-Myers Squibb Company, New Brunswick, NJ
Introduction
Over the last decade, there has been a significant focus on increasing process understanding and the implementation of Quality by Design (QbD) to ensure that pharmaceuticals matching a target product quality profile are produced. With the application of QbD, appropriate product quality is ensured through adequate process monitoring and control with the use of Process Analytical Technology (PAT). The objective of PAT is to ensure consistent manufacturing process performance and pharmaceutical product quality by taking measurements during the manufacturing process.1 A standard framework for PAT implementation in a biopharmaceutical process involves identification of Critical Process Parameters (CPP) and Critical Quality Attributes (CQAs), followed by selection of technologies to monitor and/or control those CPPs within ranges that lead to appropriate values of the CQAs. PAT provides capabilities for in-line, at-line, on-line, and off-line analysis, with in-line and on-line technologies offering continuous real-time process monitoring that facilitates implementation of in-process controls at critical unit operations rather than relying on manual sampling and analysis or end-product testing.2
The production of biotherapeutic proteins with Chinese Hamster Ovary (CHO) cells, or alternative hosts, requires careful control to achieve specified CQAs and product titer. Bioprocesses incorporating PAT into the upstream portion of the process are frequently described in the literature.3-5 Several technologies are currently in use for this application including Raman spectroscopy, Near Infrared (NIR) spectroscopy, off-gas analysis, Multivariate Data Analysis (MVDA), in-line capacitance, and on-line Ultra-Performance Liquid Chromatography (UPLC), etc.6-10 In a recent industry-wide survey,10 subject matter experts evaluated PAT technologies based on pre-defined criteria for technological attributes such as enablement of better process understanding, control, and high-throughput capabilities, as well as for business attributes such as simplicity of implementation, lead time and cost reduction. The survey results demonstrated that UPLC—on-line Patrol for protein, in-line Raman, off-gas analysis for upstream bioreactor monitoring, MVDA Real time for pulse of process (for scale-up or -down), in-line capacitance (for viable cell density), and at-line automated sampling (with/without cells) for bioanalysis testing and quality attributes control have the highest business value for upstream bioreactor monitoring and control.10 Raman spectroscopy can be employed utilizing fiber optic compatible probes for in-line measurements in multi-use and single-use bioreactors and across a wide range of bioreactor sizes. One device widely used is the Raman RXN2™, a four-channel Raman spectroscopy analyzer. Dielectric spectroscopy (capacitance) has also been widely used for real time monitoring of biomass. Capacitance spectroscopy has been reported to measure the biomass, i. e. viable cell density and viable cell volume.3,11 Incyte™ and Futura™ capacitance probes are commonly used in the industry.
Automated in-line sampling (with or without cells) for bioanalysis testing was ranked as having high business value in upstream production.12 Devices such as SegFlow™ and MAST™ allow for both cell-containing and cell-free samples to be taken automatically and sent to different instruments for at-line or off -line analysis in traditional analytical equipment. In the following sections we overview important process parameters for understanding and controlling upstream bioprocesses and present several examples of PAT applications for process optimization.
Monitoring Cell Viability, Apoptosis, and Aggregation
Robust bioprocesses are designed with the intent of reproducibility. One key area for ensuring reproducibility is cell health. Typically, manufacturing processes consider cell viability, Total Cell Density (TCD) and Viable Cell Density (VCD); assuming no changes in the specific productivity (i.e., productivity per cell per time) the number of viable cells correlates with titer. A number of methods are used in the industry to determine VCD (Figure 1). Standard cell viability measurements involve manual sampling (typically once or twice per day) with the use of the trypan blue exclusion method, which is often automated on instruments such as Vi-CELL XR™ or BioProfile FLEX 2. The trypan blue method differentiates cells based on membrane integrity, grouping cells into two groups (dead or alive).

The membrane of viable cells prevents the trypan blue dye from entering the cell, thus live cells appear unstained in the imaging analysis. The membrane of dead cells becomes compromised and porous, allowing the trypan blue to enter the cell, and the dead cells appear dark. While this method is often automated, it requires sample dilution above certain concentrations. Perhaps more importantly, the binary output (i.e., live/dead) provides little insight into the health of the cells. Cells that are in the early stages of programed cell death signaling cascades (i.e., apoptosis) often appear live in this method, as the cell membrane remains uncompromised.
Premature cell death is a failure mode of the mammalian cell culture process. Prevention of premature cell death is feasible by control actions, such as feeding, supplementation (e.g., amino acid and dextran sulfate), temperature downshift, etc. Monitoring cell health can enable timely implementation of these control actions to prevent cell death. Understanding when cells begin signaling for apoptosis, by identifying the population of cells in the early-middle apoptotic state, provides a better understanding of cell behavior and potential causes for cell death within the process and enable optimization of cell culture conditions.4,11,13
Flow Cytometry and High-Resolution Imaging for Cell Health Analysis
Flow cytometry has been used to monitor and analyze cell health during an upstream process. Markers such as annexin V, Caspases, and 7-AAD differentiate live cells from those undergoing apoptosis and dead cells. Flow cytometry is widely accepted for early cell death detection,11 but the lengthy staining procedure and instrument maintenance requirements prohibit its routine usage on the manufacturing floor. Flow cytometry is, however, very useful to train and calibrate other PAT tools (such as capacitance and dynamic imaging) that can be used in-line or on-line.
Along with flow cytometry, microscopy advances have allowed scientists to study apoptosis and cell aggregation. While microscopic analysis of cells and manual classification as a monitoring method would be more time consuming than flow cytometry, advances in both imaging capabilities and computer-based analysis can take advantage of these physiological differences for rapid, real-time analysis of cell culture. An example of this is the Canty™ Dynamic Imaging System (DIA). This DIA is a flow-through microscope that recognizes and counts the cells passing the camera. Equipped with a high-powered 8.9 MGP/15fps camera, it can be connected directly to a bioreactor autosampler such as SegFlow™ for automatic sample delivery and real-time dilution to maintain suitable concentrations for the imaging analysis. Like the Vi-CELL, the hands-on time is minimal. The DIA instrument automatically calculates the dilution required for proper imaging and auto-dilutes the sample, collects images, and produces a readout of multiple parameters.
Cell aggregates are clusters formed by multiple cells in suspension sticking together. Cell aggregation is a process of cell clumps forming during cell culture. It affects the accuracy of cell counting, and it is more impactful to the process because it hampers the efficiency of oxygen transport and nutrition diffusion, which usually leads to apoptosis and losses of productivity.14,15 It is important for certain processes to understand how many cells are in those aggregates. Smaller aggregates (dimers, trimers, and somewhat larger) may not present issues for a bioprocess and may be commonly observed. However, when cell clusters start to include higher numbers of cells, the three-dimensional organization can restrict nutrient and gassing transfer to cells within the middle of a large aggregate, which may result in cell death cascades being triggered.15 Detection of cell aggregation can facilitate the implementation of control strategies, such as the addition of anti-aggregation products such as dextran sulfate.14 The DIA imager analyzer has several advantages compared to the trypan blue-exclusion and flow cytometry (Figure 2): 1) there are no sample aspirations, resulting in the preservation of the cell aggregates and more accurate information about the size and number of the cell aggregates (Figure 2D); 2) the DIA imager can detect the beginning of apoptosis and cell death much earlier than the Vi-CELL (Figures 2A and C). The changes in the percentage of healthy and mid-apoptotic population (quadrants I+II from caspases test by flow cytometry in Figure 2C) from high viability (98% viable) at day 4 to low viability (86% viable) at day 13 can be detected with DIA but not with the Vi-CELL. 3) DIA differentiates cells based on 42 morphological features calculated per cell (direct and derived) and 1000s of cells per measurement using Support Vector Machines (SVM) (Figure 2B).

SVM is a supervised learning method that generalizes a large set of trained samples into a smaller number of support vectors to predict the class of unknown samples. The non-linear SVM algorithm builds a model to classify samples. The model represents the samples in a multi-dimensional space where the samples are separated by the maximum possible distance. The Canty Cell Classification SVM model was pre-trained using known cell images of viable, necrotic, and aggregated cells (Figure 2D). The remaining cells were classified into an apoptosis classification.
The SVM algorithm uses a Radial Basis Function (RBF) Kernel iterative process to optimize the support vector function. We controlled the optimization by using the tolerance parameter in the software. Training is terminated when the gradient of the optimized function is less than or equal to tolerance. A tolerance value that is too high may cause the SVM algorithm to terminate training before the support vector function is adequately optimized. A tolerance value that is too low will cause the SVM algorithm to try to achieve a very high level of optimization, which may be too time-consuming and computationally expensive.
This process is optimized off-line by comparison to reference samples with known cell population by flow cytometry (Corredor et al., paper to be submitted). While the algorithms must be designed for specific cell lines and bioprocesses, once in place, this is a rapid method, which generates more insight into the health of the cells than either the Vi-CELL or capacitance probes.
Capacitance for Cell Health and Apoptosis
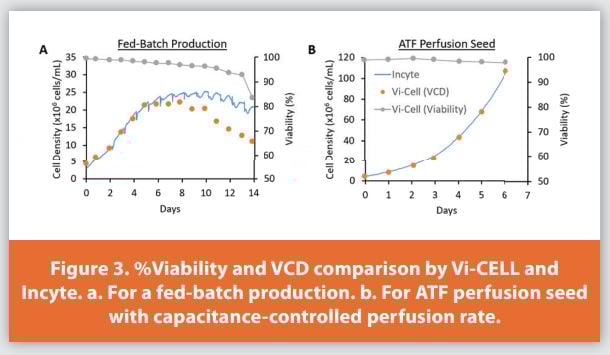
A common PAT tool for monitoring cell growth is the capacitance probe. These probes polarize the cell culture solution and measure the charge retained in cells with intact cell membranes.5,11 An advantage of using capacitance probes is that they can be placed directly into the bioreactor, allowing for a continuous data set without the removal of any sample. Figure 3A shows VCD comparison in fed-batch production, with daily Vi-CELL measurements (orange dots) compared with the in-line probe (blue line).
The viability by Vi-CELL (grey) remains above 90% through day 13 of the culture. The in-line capacitance single frequency method (Incyte) strongly correlates with the VCD by Vi-CELL during the exponential growth phase, through day 5. There is a poor correlation with late-stage production (Figure 3A, after day 6). It is well documented in the literature (much literature showed is not grammatically correct) that the biomass measurement was less accurate during stationery and death phases, leading to the hypothesis that capacitance spectra contain cell death information.11 Multifrequency capacitance has successfully been used to detect early cell death qualitatively and quantitatively using the shape factors of capacitance spectra, i.e., Cole–Cole α, and characteristic frequency. Wu et. al demonstrated that spectral shape changes could lead to a quantitative model using MVDA, which was not only used to improve the prediction of biomass but was also able to capture the cell death-related variance.11
Figure 3B shows percent viability and VCD comparison in an ATF perfusion seed study, where capacitance measurements have many benefits. Permittivity correlates strongly with total cell density up to high cell densities for healthy exponentially dividing cells such as during perfusion growth and can be easily integrated for bioreactor feedback/control as shown in Figure 3B. The in-line capacitance (Incyte) single-frequency prediction strongly correlates with VCD measurements from the Vi-CELL for densities >100 million cells/mL, sufficient for early production or seed expansion (e.g., intensified seed culture). For either early-stage production or intensified processes, the advantage of having a continuous data set is enabling recognition of deviations within the process early and with minimal sample requirement.11
Monitoring Glucose and Lactate
Glucose is a primary carbon source used by cells in industrial culture, and lactate is an important byproduct of glucose metabolism. Glucose and lactate play key roles in understanding cell metabolism. In addition, glucose and lactate are often at higher concentrations (i.e., 1-10 g/L) in industrial cell cultures than most other nutrients and metabolites; this makes them easier to monitor than lower concentration compounds such as most amino acids.
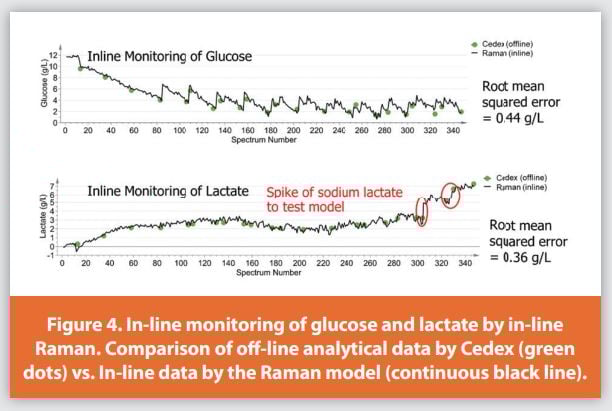
As a result of their importance and high concentrations, glucose and lactate are some of the most common targets for PAT applications. Raman spectroscopy16 had previously been used to measure glucose and lactate concentrations, typically with high accuracy (i.e., root mean squared errors < 0.5 g/L). Other options for measuring glucose and lactate in real-time include connecting a bioreactor to an autosampler, SegFlow™ or MAST™ systems, which send samples to an off-line analyzer, such as the Bioprofile FLEX (Nova Biomedical), the Cedex Bio (Roche Diagnostics Internation, Ltd), or the BioPAT® Trace (Sartorius AG).17
Glutamine, Glutamate, Other Amino Acids and Titer
Amino acids are essential components in cell culture media and play an important role in optimizing process yield and glycosylation. Amino acids are the building blocks of the proteins and provide nutrients to the cells. It is critical to monitor these components. Amino acid concentrations continuously change during the cell culture process, with amino acids either being consumed or released by the cells. Raman predictive models have been developed for several amino acids. Glutamine and glutamate are two key components that are added in cell culture media that are monitored throughout the process and have had Raman predictive models developed to monitor these components. Other amino acids such as methionine, phenylalanine, tyrosine, and tryptophan, have also been closely monitored using Raman spectroscopy.18 Three of the previous amino acids mentioned, specifically methionine, phenylalanine, and tryptophan, are considered essential amino acids. Closely monitoring these amino acids enable the ability to tightly control their concentration and allow improved productivity and consistent product quality.
During development, optimal and consistent antibody titer production is essential for a robust process. The ability to monitor antibody titer product in real-time and at increased frequency enables further process understanding. The use of Raman spectroscopy and chemometrics have been used to create Raman predictive models to monitor antibody titer production.19 It was observed that antibody titer peaks are present at various Raman spectral ranges that can be visualized during the acquisition of data.
Applications in Nutrient Monitoring and Control
Feed strategies in biopharmaceutical manufacturing processes require a delicate balance: Underfeeding results in depletion of essential nutrients, such as glucose, and eventually cell death. Overfeeding results in increases in osmolality and of concentrations of waste metabolites, such as lactate and ammonium, which can be harmful to the cell culture. Fed-batch feed strategies can be derived empirically during development using DOE or other statistical approaches to vary cell densities, feed rates, and other interacting parameters. However, a more systematic approach is to characterize the rates of nutrient consumption and replenish nutrients as they are being consumed.20 For example, knowledge about amino acid consumption rate can aid in rebalancing amino acid concentrations in feed and basal media, leading to increased VCD and product titer.21 Typically, measurements of nutrient and metabolite concentration are made off-line and feed strategies related to nutrient consumption require manual, iterative optimization by development scientists. Automated aseptic sampling coupled with PAT-based feeding solutions allow development scientists to visualize and control the nutrient consumption rates in real-time and gain a better understanding of process dynamics in between off-line samples. This is a driver for the high business impact of these technologies and helps to justify the ROI for implementation.
In addition to using PAT to learn more about the bioprocess, PAT tools have also been key enablers of adaptive feed strategies. Overall, adaptive feed strategies for complex feeds have grown in popularity in recent years.22 Conceptually, adaptive feed strategies should lead to improved process robustness and reproducibility, since deviations that impact cell density are accounted for automatically by the feed strategy. In the future, this is likely to lead to streamlined development approaches where feed strategy and cell densities do not need to be tested independently. In practice, adaptive feed strategies have also resulted in more optimized processes, leading to improvements in product titer17 and in product quality.23
An adaptive feeding approach is already commonly used for glucose. Glucose is often added to bioreactors as a supplemental feed as the levels of glucose drop below a target value. When glucose is consumed by the cells, glucose is added back to prevent glucose depletion. Since bioreactors are usually sampled on a once- or twice-daily basis, the glucose feed is also added as a once- or twice-daily bolus, resulting in a ‘saw-tooth’ range of concentrations of glucose over the course of a typical fed-batch bioreactor run. A key enabler of the adaptive feeding approach for glucose is that glucose concentrations can be readily measured after sampling, e.g., by a Nova Bioprofile FLEX or Roche Cedex Bio. With the advent of in-line or at-line PAT technologies, the ability to monitor and potentially control the levels of glucose, other feed ingredients and metabolites on a more frequent basis is possible.
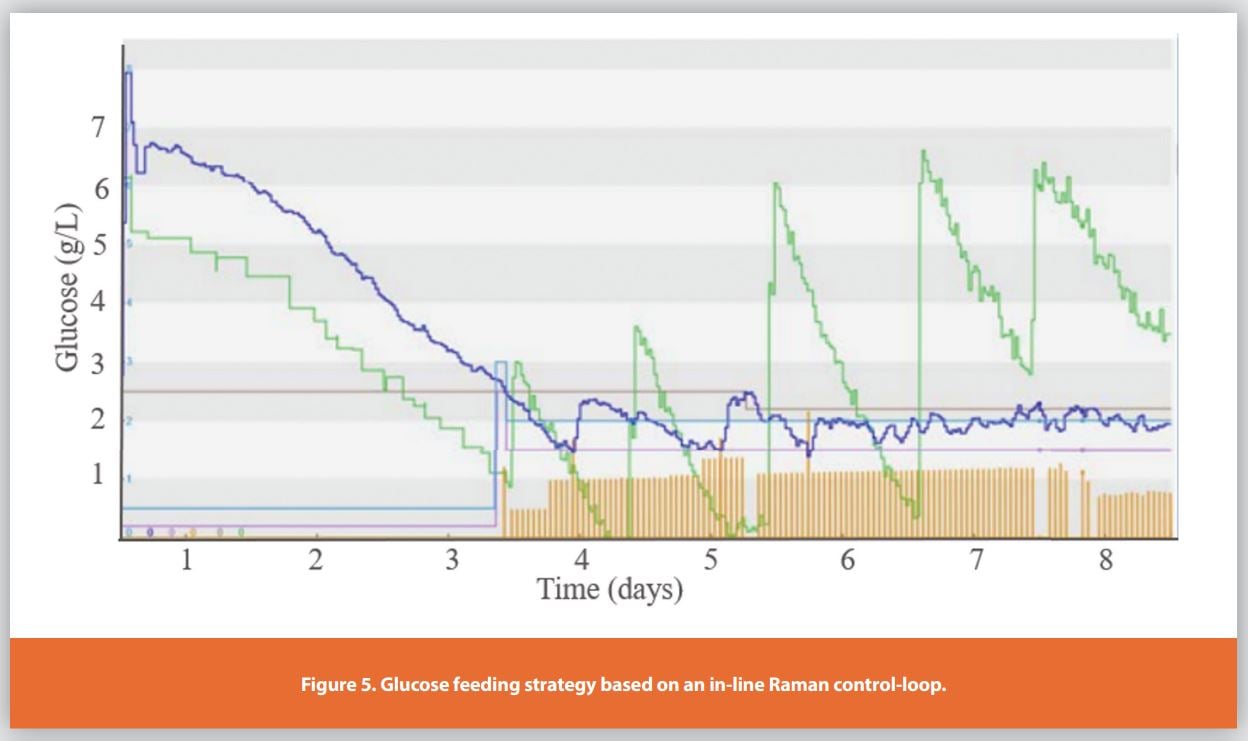
Raman-based models are now used to monitor and control the level of glucose in a process.24,25 Partial Least-Squares (PLS) models have also been built to control both glucose and lactate levels using two separate models.26 At-line technologies that can rapidly sample small amounts of bioreactor spent media have also been used to control the level of glucose in-process.27 By controlling glucose in particular, levels of lactate and osmolality are also impacted, leading to reduced product variability and improved protein quality.23 Figure 5 shows an example of a Raman-based feed control loop. A Raman model was developed to predict glucose and lactate given the in-line Raman spectra. The purpose of the Advanced Process Control (APC) model was to prevent the glucose spikes (green) due to daily feeding by delivering small aliquots of glucose (orange), to maintain the glucose concentration within the specified range (blue).28

With the recent push towards bioreactor intensification, nutrient monitoring and control has become even more essential due to higher VCD that are observed through intensified processes when compared to conventional fed-batch processes. With the increased VCD, the nutrient consumption rates can increase at a rate where significant changes can occur over the course of a day, in between the bolus nutrient feeds. As mentioned previously, PAT technologies have enabled the close monitoring of glucose to enable automated feedback loops to control glucose levels in a tight range. The feedback loop concept can also be applied in perfusion processes, such as to control the perfusion rate to maintain optimal concentrations of key nutrients in the cell culture media.
Automated Sampling
Automated bioreactor sampling is a tool which can enable PAT applications that would otherwise require manual sampling. For example, a bioreactor auto-sampler such as the SegFlow™, can interface directly with off-line analytical equipment including the Vi-CELL or Canty imager to allow for frequent, real-time measurement of cell counts and health. Samples drawn from the bioreactor may also be measured by other analytical equipment or stored in a fraction collector for future analysis.
Typical manual bioreactor sampling relies heavily upon the operator which has several drawbacks including variable time of day sampling, contamination risk, manual update of control values, and data integrity risk for traceable auditing. Automated bioreactor sampling may be scheduled for multiple times per day including weekends and communicate directly with analytical equipment for automatic data collection and real time feedback control. Contamination risk is reduced by addition of check-valves and automated cleaning cycles. The major drawback of automated bioreactor sampling is the initial capital cost of equipment and the time requirement to set up all tubing and communication cables between bioreactors, the sampler, and analytical equipment.
Conclusions
Several examples of the use and benefits of incorporating PAT tools into the cell culture process for upstream bioprocess monitoring and control are presented. Examples include application of spectroscopic techniques, such as in-line Raman and capacitance, and the use of MVDA and automated sampling. These applications are amongst the most implemented for upstream bioreactor monitoring and control. We introduced a novel imaging technique for the detection of cell death and apoptosis.
References
- FDA, Guidance for Industry PAT — A Framework for Innovative Pharmaceutical Development, Manufacturing, and Quality Assurance. September 2004
- Yu, L.X., Pharmaceutical quality by design: product and process development, understanding, and control. Pharm Res, 2008. 25(4): p. 781-91.
- Moore, B., R. Sanford, and A. Zhang, Case study: The characterization and implementation of dielectric spectroscopy (biocapacitance) for process control in a commercial GMP CHO manufacturing process. Biotechnology Progress, 2019. 35(3): p. e2782.
- Wu, S., et al., Rapid at-line early cell death quantification using capacitance spectroscopy. Biotechnology and Bioengineering. n/a(n/a).
- Wasalathanthri, D.P., et al., Technology outlook for real-time quality attribute and process parameter monitoring in biopharmaceutical development-A review. Biotechnol. Bioeng., 2020. 117(10): p. 3182-3198.
- Buckley, K. and A.G. Ryder, Applications of Raman Spectroscopy in Biopharmaceutical Manufacturing: A Short Review. Appl. Spectrosc., 2017. 71(6): p. 1085-1116.
- Arnold, S.A., et al., In-situ near infrared spectroscopy to monitor key analytes in mammalian cell cultivation. Biotechnol. Bioeng., 2003. 84(1): p. 13-19.
- Hakemeyer, C., et al., At-line NIR spectroscopy as effective PAT monitoring technique in Mab cultivations during process development and manufacturing. Talanta, 2012. 90: p. 12-21.
- Wasalathanthri, D.P., et al., Technology outlook for real-time quality attribute and process parameter monitoring in biopharmaceutical development—A review. Biotechnology and Bioengineering, 2020. 117(10): p. 3182-3198.
- Gillespie, C., et al., Systematic assessment of process analytical technologies for biologics. Biotechnol Bioeng, 2022. 119(2): p. 423-434.
- Wu, S.S.A.K., Claudia Corredor, Douglas Both, James K. Drennen Carl A. Anderson, Real�Time Monitoring of Early Cell Death in Mammalian Cell Culture Analytical Chemistry, 2022. Submitted.
- Gillespie, C., et al., Systematic assessment of process analytical technologies for biologics. Biotechnology and Bioengineering, 2022. 119(2): p. 423-434.
- Ma, F., et al., Real-time monitoring and control of CHO cell apoptosis by in situ multifrequency scanning dielectric spectroscopy. Process Biochemistry, 2019. 80: p. 138-145.
- Jing, Y., et al., Combination of dextran sulfate and recombinant trypsin on aggregation of Chinese hamster ovary cells. Cytotechnology, 2016. 68(2): p. 241-248.
- Qian, Y., et al., Hypoxia and transforming growth factor-beta1 pathway activation promote Chinese Hamster Ovary cell aggregation. Biotechnol Bioeng, 2018. 115(4): p. 1051-1061.
- Matthews, T.E., et al., Closed loop control of lactate concentration in mammalian cell culture by Raman spectroscopy leads to improved cell density, viability, and biopharmaceutical protein production. Biotechnol. Bioeng., 2016. 113(11): p. 2416-2424.
- Zhang, A., et al., Advanced process monitoring and feedback control to enhance cell culture process production and robustness. Biotechnol. Bioeng., 2015. 112(12): p. 2495-2504.
- Bhatia, H., et al., In-line monitoring of amino acids in mammalian cell cultures using raman spectroscopy and multivariate chemometrics models. Engineering in life sciences, 2017. 18(1): p. 55-61.
- André, S., et al., In-line and real-time prediction of recombinant antibody titer by in situ Raman spectroscopy. Analytica Chimica Acta, 2015. 892: p. 148-152.
- Wlaschin, K.F. and W.-S. Hu, Fedbatch Culture and Dynamic Nutrient Feeding, in Cell Culture Engineering, W.-S. Hu, Editor. 2006, Springer Berlin Heidelberg: Berlin, Heidelberg. p. 43-74.
- Xing, Z., et al., Optimizing amino acid composition of CHO cell culture media for a fusion protein production. Process Biochemistry, 2011. 46(7): p. 1423-1429.
- Yee, J.C., et al., Advances in process control strategies for mammalian fed-batch cultures. Current Opinion in Chemical Engineering, 2018. 22: p. 34-41.
- Berry, B.N., et al., Quick generation of Raman spectroscopy based in-process glucose control to influence biopharmaceutical protein product quality during mammalian cell culture. Biotechnology Progress, 2016. 32(1): p. 224-234.
- Craven, S., J. Whelan, and B. Glennon, Glucose concentration control of a fed-batch mammalian cell bioprocess using a nonlinear model predictive controller. J. Process Control, 2014. 24(4): p. 344-357.
- Huang, J., et al., AIChE PD2M Advanced Process Control workshop-moving APC forward in the pharmaceutical industry. Journal of Advanced Manufacturing and Processing, 2021. 3(1): p. e10071.
- Matthews, T.E., et al., Closed loop control of lactate concentration in mammalian cell culture by Raman spectroscopy leads to improved cell density, viability, and biopharmaceutical protein production. Biotechnology and Bioengineering, 2016. 113(11): p. 2416-2424.
- Zhang, A., et al., Advanced process monitoring and feedback control to enhance cell culture process production and robustness. Biotechnology and Bioengineering, 2015. 112(12): p. 2495-2504.
- Bobiak, J.J., D.; Vale, N.; Lane, G.; Armenante, G., Raman-based bioreactor control: building sustainable applications. SciX conference, Reno, NV, 2017.
Subscribe to our e-Newsletters
Stay up to date with the latest news, articles, and events. Plus, get special
offers from American Pharmaceutical Review – all delivered right to your inbox!
Sign up now!