Carla Luciani - Engineering and Material Sciences, Vertex Pharmaceuticals
In recent years, the adoption of continuous drug substance manufacturing has been steadily increasing. Companies such as Eli Lilly, GSK, Lonza, Novartis-MIT, Pfizer, Sanofi-Genzyme, and Sigma-Aldrich have made significant investment in continuous drug substance processing.1 Key drivers to invest in drug substance continuous manufacturing include quality assurance (e.g., minimization of process variability, diversion of non-conforming material, ability to implement advanced process controls, etc.), greener processes (e.g., process intensification, waste reduction, etc.), safer operations (e.g., ability to explore fast/energetic reactions, extreme reaction temperatures and pressures, etc.), as well as regulatory factors (e.g., modernization of pharmaceutical manufacturing). From a business perspective, practitioners value the agility, flexibility, and efficiency that continuous processes can offer as well as the advantages from supply network perspective.1
There are still many real or perceived barriers that can prevent implementation of drug substance continuous manufacturing.2 Cost of equipment, limited workforce training, technical gaps, access to capacity and capability within contract manufacturing organizations, internal sponsorship, existing fully depreciated batch infrastructure, and lack of experience with regulatory interactions are just a few barriers reported by companies trying to make the transition from traditional batch processing to continuous manufacturing.2
Also growing prominently are Modeling and Simulation (M&S) tools used to support process development by improving process understanding, facilitate process optimization, investigate various processing alternatives, and increase cost savings. This short article focuses on the use of M&S tools to inform business cases for drug substance continuous manufacturing.
At early stages of synthetic molecule process development, experimental data is collected to assist the initial design of all unit operations required to produce an active ingredient. Unit operations usually includes reactions, purifications by extractions and crystallizations, solvent exchanges, isolation and drying. Kinetic and calorimetric data, partition coefficients, solubility, desupersaturation rates, and phase diagrams usually need to be collected to make initial process design decisions. While late-stage model development may require a significant amount of experimental data to feed activities such as model discrimination, model parameter estimation, and/or model validation (Figure 1), the level of accuracy for models used to support business cases at early stages is less stringent and the design-supporting data is frequently acceptable.

From the plethora of models used in drug substance process development, mechanistic models are especially useful because they employ the same underlaying experimental data to describe either batch or continuous processes, and the same parameters can be used to compare the performance of batch, hybrid, and continuous processes. In addition to performance comparison, these simple mechanistic models can be also useful to estimate Residence Time Distribution (RTD), assess the ability of a process to adapt to changes in demand during both clinical and commercial stages, optimize location and size of surge cans, define sampling frequency for Process Analytical Technology (PAT), design protocols to divert non-conforming material, etc.3
In what follows, a simple example of an early-stage model used to inform a business case for continuous manufacturing is presented.
Case Study
For certain therapeutic areas, a significant increase of demand may be expected throughout clinical development and after commercialization. In those cases, flexibility to scale-up (or scale-out) can be extremely beneficial.
In this case study, the feasibility of converting one step of the proposed registered sequence to continuous process is discussed.
The investigated step involves a reduction reaction and the following workup. In semi-batch mode, the starting material is dissolved in a solvent and the temperature is reduced before initiating the semi-batch addition of a reducing agent. Due to the significant exothermicity of the reaction, the reducing agent must be added slowly to ensure reaction completion while maintaining temperature below a given threshold (T1) that minimizes impurity formation. Once the starting material reduction is complete, an organic solution containing a quenching agent is added to quench any excess of the reducing agent. Then, an aqueous solution containing a second quenching agent is added to quench the product while maintaining the temperature below a given threshold (T2) that minimizes impurity formation. The quenched product is initially extracted by a liquid-liquid extraction followed by aqueous washes. In the last step of the sequence, the organic layer undergoes a put and take distillation to reduce its water content in the final solution containing the product.
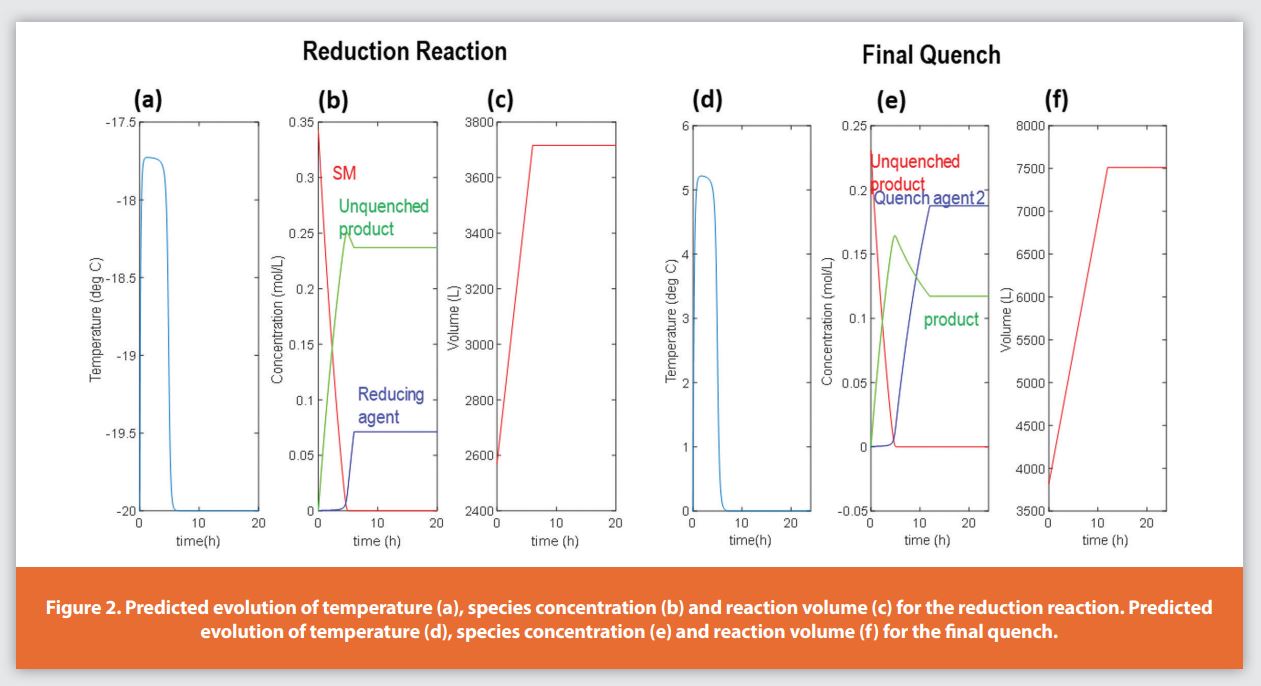
A simple mechanistic model was developed based on heat of reaction and heat of quench (obtained as part of a safety assessment), partition coefficients for the extractions, and by assuming very fast reactions. Figure 2 shows the predicted evolution of temperature, species concentration and reaction volumes for the reaction and the final quench for a 2000-gallon reactor. At this scale, the reducing and final quenching agents should be added in no less than 7 h and 12 h, respectively to ensure the temperatures thresholds are not violated (T1 =-15 °C and T2 = 6° C).
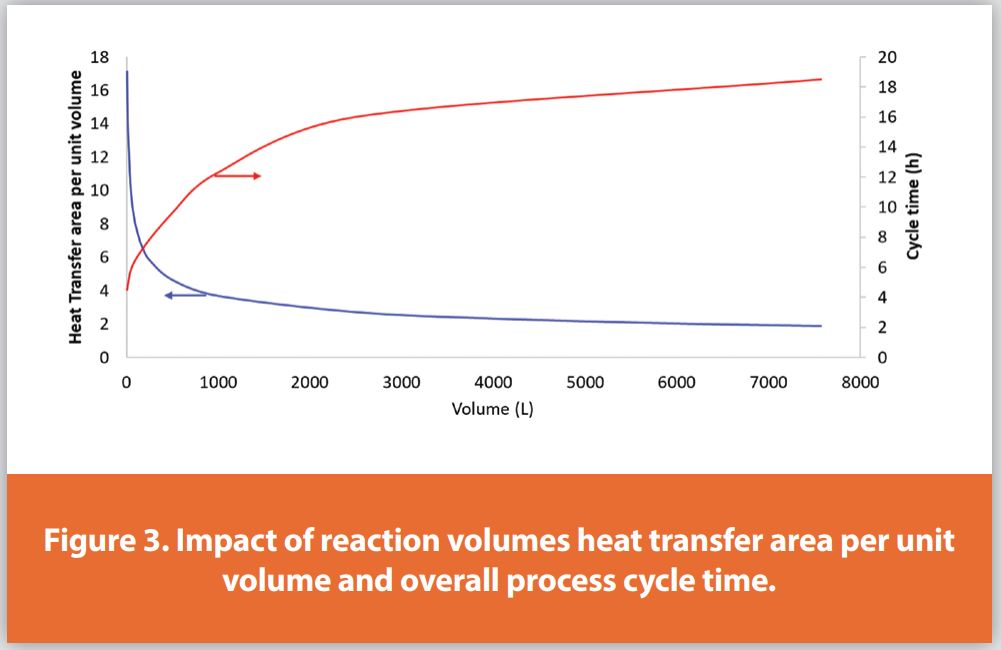
Figure 3 shows the predicted impact of increasing process scale to heat transfer and cycle time. Reducing the process footprint could help improve heat removal efficiency as well as reduce cycle time.
As a potential improvement, a hybrid process involving a continuous reaction and a semi-batch workup was simulated. The existing semi-batch mechanistic model was slightly modified to simulate the reduction reaction in a plug flow reactor (dispersion number assumed zero for simulation purposes), while maintaining the workup as a semi-batch operation. Model predictions are shown in Figure 4. It was estimated that for a throughput of ~300 Kg of product/day, a 2.5 L tubular reactor could be used. As the quench still required large vessels and long cycle times, this hybrid alternative did not represent a significant improvement over semi-batch mode.
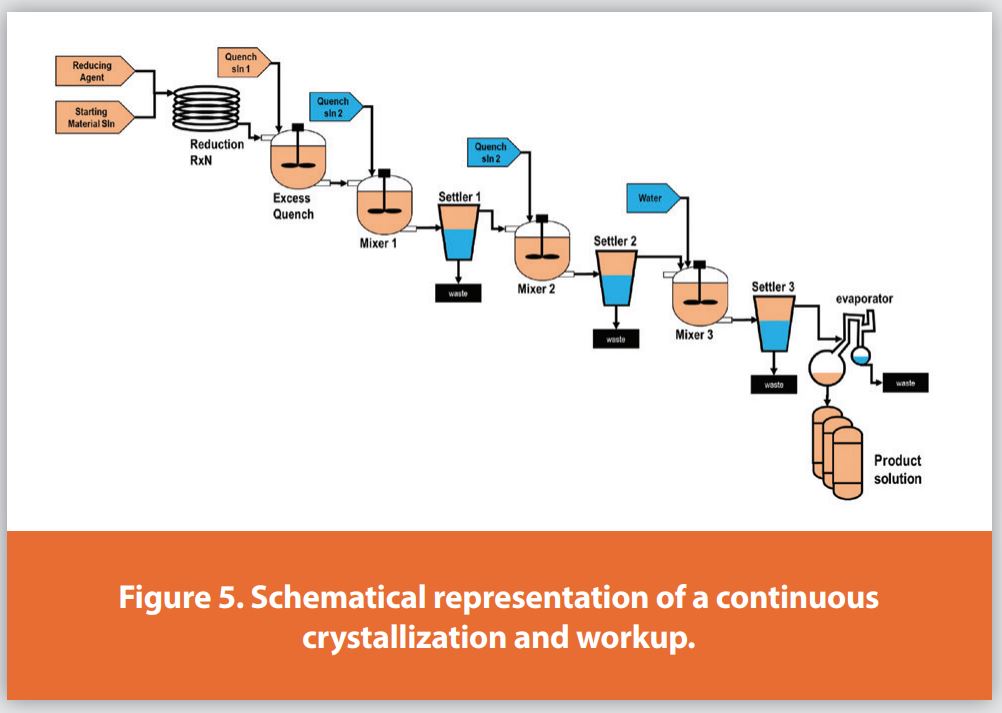
A fully continuous reaction and workup were also simulated. For that purpose, model equations were slightly modified again to consider the case where workup operations are also performed in a continuous fashion (Figure 5). Ideal Continuous Stirred Tank Reactors (CSTRs) were assumed for mixer and equilibrium conditions for settlers.4 In this final case, simulations were used to design average residence time needed in each piece of equipment in the train for a throughput of ~20 Kg/day of product. For the tubular reactor and mixer/settler configurations, average residence times of 1 and 45 min, respectively were capable of meeting processing needs. Equipment sizing was used to estimate facility occupancy. Using the data reported by Collins and Luciani. (2019),5 ~2 fume hoods would be needed to perform the reaction and workup operations.
Conclusions
In this brief communication, a simple mechanistic model developed from limited data was used to exemplify how business decisions can be informed by model and simulation tools at early stages of process development. As development programs accelerate and drug substance molecular complexity increases, early decisions are increasingly important in defining the commercial process. In this environment, modeling and simulation are vital tools to make informed decisions.
References
- J. Srai, E. Settanni, P. Aulakh. Chapter 14 - Evaluating the business case for continuous manufacturing of pharmaceuticals: A supply network perspective. In Continuous Pharmaceutical Processing. Z. Nagy, A. El Hagrsy, J.Lister. AAPS 2020, pp. 477-512
- J. McWilliams, A. Allian, S. Opalka, S. May, M. Journet, T. Braden. The Evolving State of Continuous Processing in Pharmaceutical API Manufacturing: A Survey of Pharmaceutical Companies and Contract Manufacturing Organizations. Org. Process Res. Dev. 2018, 22, 9, 1143–1166.
- M.D. Johnson, S. May, J. Groh, L.P. Webster, V. Shankarraman, R. Spencer, C.V. Luciani, C.S. Polster, T. Braden. Understanding Residence Time, Residence Time Distribution, and Impact of Surge Vessels. In Z. Nagi, A. El Hagrasy, J. Lister Continuous Pharmaceutical Processing. AAPS Advances in the Pharmaceutical Sciences Series 2020, 42, 51-86.
- M. Johnson, C. Burcham, S. May, J. Calvin, J. Groh, S. Myers, L. Webster, J. Roberts, V. Reddy, C. Luciani, A. Corrigan, R. Spencer, R. Moylan, R. Boyse, J. Murphy, J. Stout. API Continuous Cooling and Antisolvent Crystallization for Kinetic Impurity Rejection in cGMP Manufacturing. Org. Process Res. Dev. 2021, 25, 6, 1284–1351.
- P. Collins, C. Luciani. Continuous Manufacturing – Framing a Future for Patients. 4th FDA/PQRI Conference on Advancing Product Quality: Patient Centric Product Design, Drug Development, and Manufacturing. 2019. [online] https://pqri.org/wp-content/uploads/2019/04/2-PCC�CVL-PQRI-FDA-2019-presentation-FINAL.pdf (accessed 02-26-2022)
Subscribe to our e-Newsletters
Stay up to date with the latest news, articles, and events. Plus, get special offers
from American Pharmaceutical Review – all delivered right to your inbox! Sign up now!