Abstract
FTIR (Fourier Transform Infrared Spectroscopy) process analyzers have been shown to be a convenient and versatile analytical tool for monitoring reactions in real-time during flow chemistry development and manufacture. In this example, on-line FTIR is first applied to a Curtius rearrangement reaction in a batch mode, which provides the chemist with insight into both the mechanisms and kinetics of the chemistry being developed. The results from the experiments conducted in batch mode are then applied to enable the development of the flow chemistry process. An FTIR probe was also incorporated into the flow production process via a home-built “flow cell” to allow real-time monitoring of the flow chemistry. FTIR has proven to be a valuable tool for the rapid development and optimization of the Curtius flow chemistry reaction by providing information on the reaction kinetics, flow stream dispersion, impurity profile, reaction progression and also allowed monitoring of the flow system during cleaning verification.
Introduction
Continuous flow methodology (CFM) can provide an opportunity to reduce the time needed for active pharmaceutical candidate identification [1-3]. In addition, flow chemistry enables reactions to be safely performed at pressure and temperature higher than that obtainable in batch mode, thereby allowing many transformations to be effectively performed that would not be viable under normal batch conditions. In addition, when operated under a high-temperature and high-pressure process intensification regime, many slow transformations can be accelerated sufficiently to allow rapid production. Another important advantage of CFM is the ability to control processes to minimize undesired by-products, thereby eliminating purification steps [2-3]. This aspect is particularly relevant for reactions in which toxic and hazardous by-products can be generated if optimal reaction conditions are not maintained.
These benefits have prompted a number of pharmaceutical companies to increasingly apply CFM in active pharmaceutical ingredient (API) manufacturing processes for early stage development [2, 4]. As CFM is integrated into routine manufacturing processes there will also be a concomitant need for improved analytical technologies. Traditional analytical methodologies such as gas chromatography (GC) and liquid chromatography (LC) based separation techniques have historically been used for off-line analysis. These tools can provide accurate and reliable information on the multiple components existing in a reaction mixture, however, because of the challenges intrinsic in conducting separations, on-line analysis and real-time feedback are more difficult with these traditional techniques [5,6].
In order to optimize and synchronize control of ongoing reactions using CFM, it becomes imperative that an analytical technique be able to provide continuous, real-time data that can be used to maintain optimal reaction conditions via feedback control. Spectroscopy-based process analytical technologies (PAT), such as FTIR and Raman process analyzers, have proven to be valuable tools for solving some of the most challenging analytical issues in flow chemistry [7-11]. In 2007, Pelletier, et al. reported that they installed a Raman probe in a home- built ozonolysis continuous flow system, and were able to quantitatively track the levels of starting materials, intermediate and product [8]. They demonstrated the benefit of using on-line analytical technology to allow for quick reaction optimization assessments. In 2009 and 2010, Ley, et al. collaborated with an instrument company to develop a commercial flow IR cell for micro- and mesofluidic CFM in their laboratory. This work opened a new opportunity for easy in-line flow stream analytical monitoring [9-11].
The present investigation shows how real-time IR spectroscopy can be effectively employed in the development and optimization of a CFM for the production of an investigational drug substance.
Experimental
Batch mode reactions were conducted in a 50 mL glass reactor, which controls the reaction stir speed and temperature. The reactor has four ports: one installed with a glass stirrer rod and paddle, one mounted with a thermocouple, one equipped with an immersion IR probe, and the last equipped with a reflux condenser.
The Curtius rearrangement reaction was carried out in a batch mode using the following experimental conditions: 22 mL of toluene was placed in the reactor and 1.0 g of a carboxylic acid and 1 molar equivalent of TEA were added. After complete dissolution, 1.05 equivalent of diphenylphosphoryl azide (DPPA) was added into the reactor and the solution was ramped up to 115 °C at a step of 5 °C/min.
IR Probe and Spectrometer
An IR probe (8” long and ¼” O.D.), comprising an integrated attenuated total reflectance (ATR) gold sealed silicone optical crystal (refer to SiComp), was attached to a 1.5 m AgX fiber, through which the light was transmitted from the silicone crystal to a spectrometer, equipped with an interferometer and a mercury cadmium telluride (MCT) detector, which is cooled with liquid nitrogen. The IR spectrometer is controlled and the raw data are collected using the iC IR Software. The iC IR was also used for data analysis and mathematical data treatment.
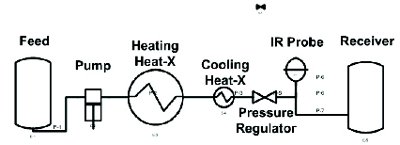
Figure 1. Flow System Diagram
Production Flow Reactor
The reactor system consisted of feed and receiver tanks, pumps, a thermostatted reaction zone (consisting of a coiled Stainless Steel Hastelloy tube of total volume 2 L), a safety relief system, and a back pressure regulator as shown in Figure 1. The reaction solution was continuously fed to the reaction zone using reciprocating syringe drive pumps. Oil was supplied to the vessel by a circulator which was capable of maintaining the temperature between ~50 to 250 °C. Once through the reaction zone the reaction mixture was cooled to room temperature with a heat exchanger and discharged through a back pressure regulator to a receiver tank.
Results and Discussion
Using ‘On-line IR’ for Curtius Rearrangement Reaction Flow Chemistry Development
The Curtius rearrangement (see scheme 1), starting from a carboxylic acid, is a common reaction for the preparation of isocyanates and their secondary products via an acyl azide rearrangement [12]. Although the reaction is very versatile in the synthesis of many pharmacologically active compounds, its use, especially at large scale, has been avoided because of significant safety concerns around the use and/or the generation of potentially explosive/toxic azide promoters and the associated acyl azide intermediates [13]. The improved safety features derived from working in a flow mode offer the potential to use this chemistry safely even at a production scale.
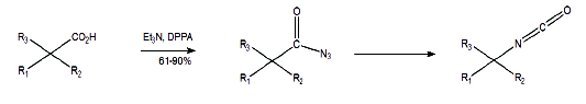
Scheme 1. Curtius rearrangement reaction starting from a carboxylic acid
The CFM process development requires both the understanding and optimization of the chemistry (i.e., reaction mechanisms, conditions, kinetics, etc.) and establishment of the appropriate process controls to be successful. In order to facilitate the development of the Curtius rearrangement reaction described in Scheme 1, experiments were first carried out in a batch mode as described in the experimental section using an FTIR probe to collect real-time reaction data.
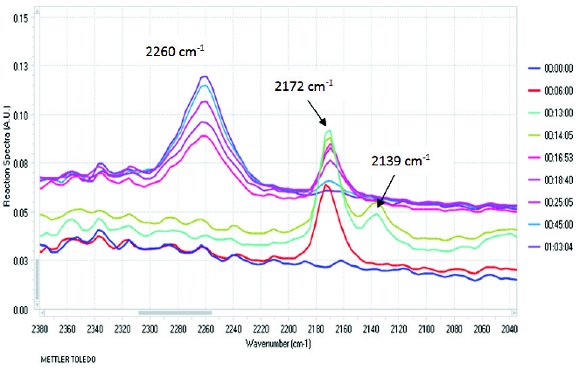
Figure 2. Expanded spectra for on-line monitoring of a Curtius rearrangement reaction in batch
Figure 2 shows the real-time IR spectra in a selected spectral region for on-line monitoring of the Curtius rearrangement reaction in a batch mode. The band at 2260 cm-1 is due to the asymmetric stretching vibration of the -N=C=O group in the isocyanate product as reported [14], while the band at 2172 cm-1 has been attributed to an asymmetric -N3 stretching vibration in DPPA. The 2172 cm-1 peak assignment was confirmed by comparing it with DPPA reference spectrum (not included). Therefore, as shown in the trend analysis in Figure 3, the addition of DPPA leads to an abrupt increase of the 2172 cm-1 band, which then decreases as the DPPA is consumed to form the acyl azide intermediate and the isocyanate product. The band at 2139 cm-1, close to assigned -N3 stretching vibration in DPPA, has been attributed to the -N3 stretching vibration in the acyl azide intermediate formed. This is confirmed by the trend analysis as shown in Figure 3, where the trend using 2139 cm-1 band starts forming at the same time the DPPA is added into the reaction and then it keeps increasing until the temperature reaches approximately 63 °C, where the 2139 cm-1 band starts decreasing while the -N=C=O band at 2260 cm-1 increases significantly indicating the formation of the isocyanate product from the acyl azide intermediate. These data show that the acyl azide intermediate is formed at ambient temperature, and does not undergo rearrangement to form the isocyante at a significant rate until the critical temperature is achieved. While the formation of the isocyanate product is sensitive to temperature, the data show that the isocynate is stable for at least 2 hours at 115 °C, with no degrading (i.e., decrease) being observed for the 2260 cm-1 band in Figure 3. The 2260 cm-1 trend analysis indicated that approximately 90% of the reaction occurs in 45 minutes and the reaction is complete in two hours as indicated by the plateau.
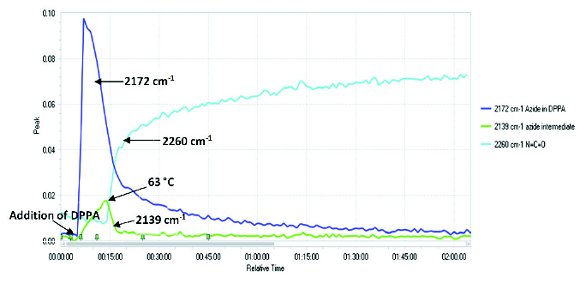
Figure 3. Trend analysis using selected bands for a Curtius rearrangement reaction in batch mode
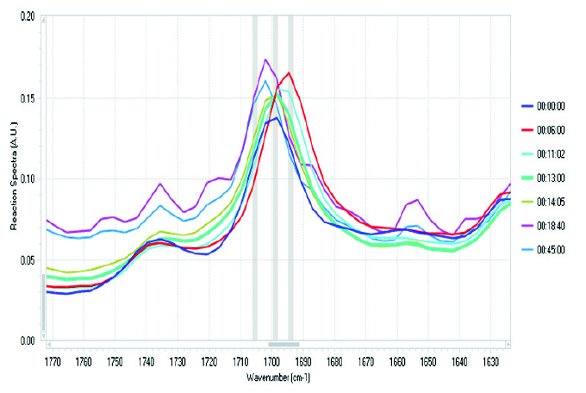
Figure 4. Expanded spectra for on-line monitoring of a Curtius rearrangement reaction in batch
Some significant changes were observed in other spectral regions as well. For example, as shown in Figure 4, the band due to -C=O around 1700 cm-1 shifts and its intensity changes, reflecting the electron density variation around -C=O group in the molecules during the reaction [11].
However, the spectral resolution for the –C=O bands is not favorable for reaction monitoring in this case, therefore, the bands around 2260-2130 cm-1 were chosen for trend analysis in Figure 3 as they are directly associated to the changes of the functionalities in the Curtius rearrangement reaction.
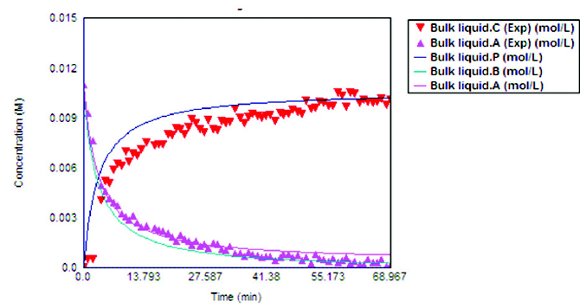
Figure 5. FTIR trend analysis and fi tted kinetic plots
The IR trend analysis data for the DPPA azide peak at 2172 cm-1 and the product isocyanate at 2260 cm-1 was used for kinetic modeling, assuming constant molar absorptivity and 100% yield of the product at the plateau. We recognize that both are strong assumptions but consider them suitable for the purposes of this investigation. This enables the IR profiles to be translated into concentration profiles, which were subsequently fit to a second-order kinetic model using an engineering software. Fitting results are illustrated n Figure 5, where “A” represents the DPPA and “C” and “P” the experimental and fit values of the isocyanate concentration, respectively, while “B” is predicted acid kinetic profile by the model based on the DPPA.
These data were utilized to determine the mean residence time required for the reactants in the flow reactor. As the plot in Figure 5 shows, the reaction appears complete in about 70 minutes.
Using On-line IR for Curtius Rearrangement Reaction Flow Production
Table 1. Conditions for Curtius rearrangement reaction in production flow
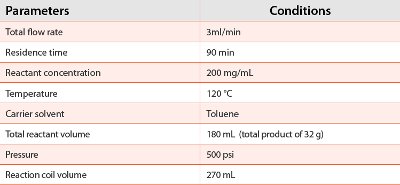
The kinetic results derived from the FTIR data and model in Figure 5 were applied to flow scale-up with consideration of the flow production system configuration. Specifically, the kinetic model indicated that the reaction completes in 70 minutes while FTIR indicated that the reaction might take longer. However, since no product degradation was observed at a temperature as high as 115 °C in 2 hours as shown in Figures 2 and 3, a resident time of 90 minutes at 120 °C was selected. Based on the flow coil length, the flow rate of 3 mL/min is needed for 90 minutes residence time. All conditions for flow scale-up are listed in Table 1.
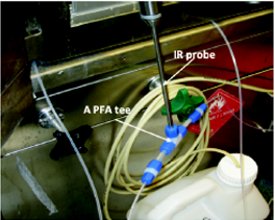
Figure 6. Connection between an IR probe and a production flow system
The IR probe used for the batch study was connected to the outlet of the production flow system after the back pressure regulator via a 3-way PFA tee with port size of ¼ inch as shown in Figure 6. This allows real-time IR spectra to be obtained on the flowing reaction stream. The outlet of the tee is connected to tubing leading to a receiver. Spectra were collected at a rate of one spectrum every minute.
Figure 7 shows the real-time IR spectra, in the same spectral region as in Figure 2, for the scale-up flow of the Curtius rearrangement reaction. The spectral profile in Figure 7 is very similar to that in Figure 2, with a couple additional details. Data obtained from probe in the flowing stream (Figure 7) not only represents the reaction progress, but also shows the elution and dispersion of the reactants and products in the flow stream. This can be seen better using the trend analysis plot in Figure 8, which uses the bands identified during the chemistry development. The 2172 cm-1 band, representing DPPA, shows a sharp peak at approximately the 6th hour (in green). The increasing portion of the peak is due to the fact that DPPA is pumped into the flow stream first before the carboxylic acid is introduced, while the decreasing portion of the peak indicates that DPPA is consumed immediately to form the acyl azide (red line) and isocyanate (blue line) as the carboxylic acid is pumped into the stream and mixed with DPPA. However, as noted during the batch chemistry study, acyl azide is not very stable at high temperature and was quickly converted into the isocyanate. Therefore, a minimum of acyl azide was observed in the reaction stream segment except for the first half hour (5 ¾ - 6 ¼ hours in time scale in Figure 8). During this time scale, although isocyanate was formed, the stream was a mixture of DPPA, acyl azide and isocyanate (see expanded trend analysis window in the insert in Figure 8). After 6 ¼ hours, minimum of acyl azide and DPPA were observed in the flow stream as shown in Figure 8. In order to minimize the process impurities in the product, the flow stream during 5 ¾ - 6 ¼ hours time scale can be discarded. These data demonstrate how on-line IR analysis can provide real-time guidance with respect to product collection resulting in the highest quality product possible thereby minimizing the need for post-reaction isolation and clean-up procedures.
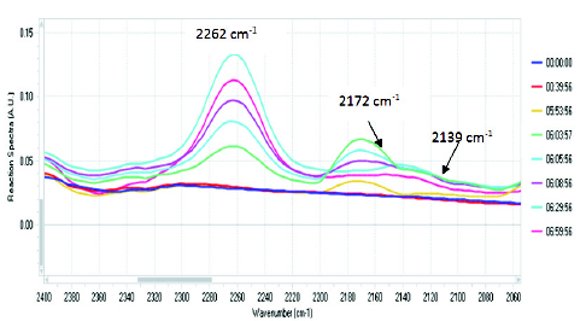
Figure 7. Expanded spectra for on-line monitoring of a Curtius rearrangement reaction in flow
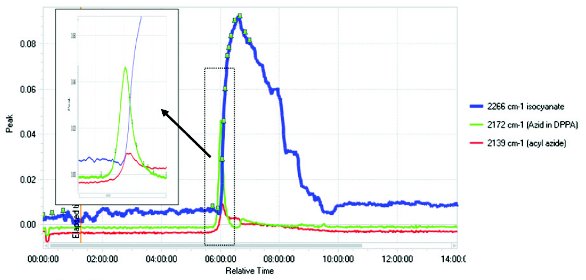
Figure 8. Trend analysis for on-line monitoring of a Curtius rearrangement reaction in flow
As shown in Figure 8, the trend of the isocyanate reaches the maximum, and then starts decreasing gradually and does not reach the “steady state” as expected. This could be due to two reasons: 1) the total reaction volume is relatively small for this production run to allow for a truly “steady state” profile to be obtained; 2) the decreasing trend for the 2262 cm-1 band is the result of reaction stream dispersion in the flow system. Although a plug flow model indicated that the whole reaction stream should be out of the flow system in 2 hours, the data from the on-line IR presented in Figure 8 shows that it took approximately 4 hours for the reaction to completely elute out of the flow system. This has been attributed to dispersion of the flow stream within the system.
In terms of reaction progression, from Figure 8 it can be estimated that the reaction was completed with less than 5% of the acyl azide and the DPPA relative to the isocyanate (assuming that IR bands selected for DPPA, the acyl azide intermediate and the isocyanate have the same response factor). The isolated product was analyzed using an off-line UPLC method which confirmed 90% purity for the 30 g isocyanate product with 96% isolated yield for this flow production process.
Conclusions
On-line reaction monitoring tools, FTIR in this case, have proven useful for both flow chemistry development and flow production. First, the study demonstrated that on-line FTIR monitoring of a batch Curtius rearrangement reaction provides information on the chemistry, generates the data for the kinetic study, and establishes analytical control schemes to ensure product quality, facilitating the flow chemistry development and scale-up. Second, utilization of PAT tools has proven to be a good analytical strategy for real-time control of the flow production process. As demonstrated, real-time reaction monitoring using the FTIR probe provided: 1) information on dispersion of the reaction within the flow system; 2) critical information with respect to when the stream of product elutes out; 3) how long it takes for the reaction to reach the steady state; 4) the optimal time to collect product to obtain the highest purity possible; and 5) the semi-quantitative purity results of the product. Ideally, the PAT tool provides not only on-line qualitative/semi- quantitative information, but also real-time quantitative results such as product concentration. However, because of the dynamic nature of early-stage projects, the current investigation focused primarily on qualitative/semi-quantitative aspects of PAT tools to support the development and implementation of flow chemistry for manufacturing API to be used in toxicological and FIH studies. The successful kilo-gram scale-up of a CFM for the Curtius reaction has demonstrated that PAT tools can provide the chemist and engineers key information required to develop efficient flow chemistry paradigms.
Acknowledgments
The authors would like to acknowledge Russell J. Shine, Brian R. Morgan and Groton Kilo lab colleagues for their assistance in reaction monitoring for flow chemistry. The authors would like to thank Ken Waterman and Stephen Brune for review comments. Finally, we would also like to thank the sponsors of the Groton RAPI flow team and the management of Research Science and Technology, Pfizer, for their support.
References
- I. R. Baxendale, J. J. Harward, S. V. Ley, and G. K. Tranmer, Pharmaceutical Strategy and Innovation: An Academics Perspective. ChemMedChem., 2007, (2) 768-788.
- C. Wiles, P. Watts, Continuous- flow organic synthesis. A Tool for the Modern Medicinal Chemist, Future Medicinal Chemistry, 2009, 1(9) 1593-1612.
- T. Razzaq, C. O. Kappe, Continuous Flow Organic Synthesis Under High-temperature /Pressure Conditions. Chemistry--An Asian Journal, 2010, 5(6) 1274-1289.
- R. C. Wheeler, O.Benali, M. Deal, E. Farrant, S. J. F. MacDonald, B. H. Warrington, Mesoscale Flow Chemistry : A Plug- Flow Approach to Reaction Optimization. Org. Process.Res. Dev., 2007, 11(4) 704-710.
- C. N. Chisolm, C. R. Evans, C. Jennings, W. A. Black, F. J. Antosz, Y. Qiang, A. R. Diaz, R. T. Kennedy, Development and Characterization of “Push-pull” Sampling Device with Fast Reaction Quenching Coupled to High-performance Liquid Chromatography for Pharmaceutical Process Analytical Technologies. J. Chromatogr., A, 2010, 1217(48) 7471-7477.
- J. P. McMullen, K. F. Jensen, Rapid Determination of Reaction Kinetics with an Automated Microfluidic System. Org. Process. Res. Dev., 2011, (15) 398-407.
- K. L. A. Cha, S. Gulati, J. B. Edel, A. J. d. Mello, S. G. Kazarian, Chemical Imaging of Microfluidic Flows Using ATR-FTIR Spectroscopy. Lab on a Chip, 2009, (9) 2909-2913.
- M. J. Pelletier, M. L. Fabiilli and B. Moon, On-Line Analysis of a Continuous-Flow Ozonolysis Reaction Using Raman Spectroscopy. App. Spectrosc., 2007, 61 (10) 1107-1115.
- C. F. Carter, I. R. Baxendale, M. O’Brien, J. J. Pavey and S. V. Ley, Synthesis of Acetal Protected Building Blocks using Flow Chemistry with Flow I.R. Analysis: Preparation of Butane-2,3- Diacetal Tartrates. Org. Biomol. Chem., 2009, (7) 4594.
- S. V. Ley, H. Lange, C. F. Carter, The Application of the ReactIRTM Flow Cell to Continuous Processing Technology, Webinar with Mettler Toledo, 2009.
- C. F. Carter, H. Lange, S. V. Ley, I. R. Baxendale, B. Wittkamp, J. G. Goode, and N. L. Gaunt ReactIR Flow Cell: A New Analytical Tool for Continuous Flow Chemical Processing. Org. Process. Res. Dev., 2010, (14) 393-404.
- J. J. Li, Name reactions (2nd edition); Springer-Verlag Berlin Heidelberg, 2003.
- M. Baumann, I. R. Baxendale, S. V. Ley, N. Nikbin, C. D. Smith, Azide Monoliths as Convenient Flow Reactors for Efficient Curtius Rearrangement Reactions. Org. Biomol. Chem., 2008, 6(9) 1587-1593.
- G. Socrates, Infrared and Raman Characteristic Group Frequencies (3rd edition); John Wiley & Sons, Ltd: Chichester, 2001.
Author Biographies
Yanqiao Xiang is a principle scientist at Pfizer Inc. in Groton. Under the supervision of Professor Milton L. Lee, she received her Ph. D. from Brigham Young University in 2004. In the same year, she joined Pfizer, where she works as an analyst to support API and drug product development from early drug candidate through NDA filing. Her areas of expertise include separation science and process analytical technology.
John Lucas has been working at Pfizer for 13 years. He has experience in Medicinal Chemistry, Radio Chemistry, Chemical Technology, and most recently Continuous Processing. John Graduated from Connecticut College with his B.A in Biochemistry. John also holds associate degrees in both Criminal Justice and Forensic Science.
John Van Alsten was born by the banks of the Rouge River in rural Detroit. He studied the works of Shelby Foote and J. Willard Gibbs by firelight in the family cabin prior to attending Hope College and then the University of Illinois. His engineering career has included stints with Shell Development, DuPont, and Pharmacia and Upjohn and has involved work on heterogeneous catalysis, polymer science, and pharmaceutical manufacturing. His current focus is on rapid engineering of flow processes for early API development.
Bryan Li received a B.S. from East China University of Technology in 1986 and Ph.D. in organic chemistry under the guidance of Prof. Elie Abushanab from the University of Rhode Island in 1993. He then worked as a postdoctoral fellow in Prof. Gary Posner’s group at the Johns Hopkins University at Baltimore, Maryland. In 1996, he moved overseas and worked in the National University of Singapore, and returned to the U.S. in 1998 to join Pfizer, Inc. (Groton, Connecticut) as a process chemist. At Pfizer, he serves as a program lead responsible for exploratory process development of drug candidates in the Chemical Research & Development.
Brian R. Preston is a senior associate scientist with Pfizer Global R&D in Groton, CT. Brian graduated from Michigan State University with high honors in 2005, and began his career with Pfizer the following year. Within Pfizer Analytical R&D he has developed analytical methods to support the development of APIs and drug products ranging in phase from discovery through phase III. He specializes in chromatographic method development and on-line reaction monitoring using spectroscopic techniques.
Michael Lovdahl, Associate Research Fellow, is a group leader in Research Analytical Department in the Research Science and Technology division of World Wide Pharmaceutical Sciences for Pfizer. Michael has seventeen years of experience at Pfizer, producing over twenty publications and patents. Michael received his B.S. in Chemistry and Mathematics from the University of Minnesota and his Ph.D. in Chemistry from the University of Iowa.
Cheryl Hayward is a Research Fellow in the CRD group at Pfizer. She joined Pfizer in 1993 after receiving her Ph.D. from Yale University working with Professor Sam Danishefsky. She worked initially in the medicinal chemistry department in the atherosclerosis area. For the past four years, she has worked in the early development group within CRD where she has promoted technologies, such as flow chemistry, in early enabling and API production.