Introduction
Process Analytical Technologies (PAT) for pharmaceutical manufacturers requires the development of new tools for identification and measurement of Critical Process Parameters (CPPs) meant to be further used for process control in a quality-by-design (QbD) approach to drug manufacturing [1]. One of the CPPs demanding for a non-invasive chemically-selective tool is intermediate and end-product content uniformity. Based on the collection of spectral information at a number of spatial positions, chemical imaging offers dynamic, non-invasive, and compositional analysis of chemically heterogeneous materials. Chemical imaging can be achieved in two ways, either by shifting the sample and obtaining full spectrum at every position (often referred to as chemical mapping) or by obtaining whole field of view images of the sample through a number of spectral windows. The latter approach directly produces chemical images of components if all components have at least one distinctive spectral feature. In order to deconvolute the overlapped spectral components, multivariate analysis is commonly used to process the chemical images [2].
At present, near-infrared (NIR) chemical imaging [3-6] is widely utilized by the pharmaceutical industry for quality control based applications [7]. NIR technique allows fast chemical imaging (in the order of minutes) of components in a tablet or other compact (e.g., a roller compacted ribbon) or composite (e.g., a polymer-based film). Furthermore, the large field of view permits simultaneous imaging of multiple samples. However, the large penetration depth of NIR radiation into the sample [8] results in the low spatial resolution of NIR chemical imaging, making it difficult to map minor components [9]. If higher spatial resolution and better chemical selectivity is required, Raman chemical imaging becomes the tool of choice [6, 10, 11]. The less overlap between Raman spectral features of pure components and its higher spatial resolution make Raman chemical imaging more sensitive to the presence of minor components [6]. Furthermore, confocal Raman mapping provides spatial resolution as high as 1 μm. One shortcoming, however, is that the technique often needs tens of hours for acquiring an image due to low signal levels of spontaneous Raman process. Line illumination [12, 13] and global illumination Raman techniques [13-15] offer one to two orders of magnitude higher acquisition speeds [16, 17]. However, line illumination and global illumination have smaller spatial resolution and therefore are less sensitive to minor components due to diffusion of the excitation laser light inside the sample [18].
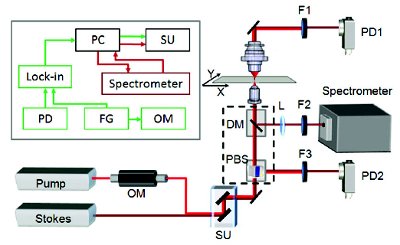 Figure 1. Optical layout and block-diagram for a stimulated Raman scattering microscope. OM: optical modulator, SU: scanning unit, L: achromatic lens of 100mm focal length. DM: dichroic mirrors for Raman microscpectroscopy. PD1 and PD2: large area photodiodes. PBS: cube polarization beam splitter. DM and PBS are installed in interchangeable turret under objective. F1 and F3 are bandpass filters for SRS imaging. F2 is bandpass filter for Raman microspectroscopy. The two laser beams are focused into the sample using a 10× (N.A.= 0.4) or 20× (N.A.= 0.75) air objective. The insert shows the block diagram of stimulated Raman scattering microscope. PC: personal computer. FG: function generator. Lock-in: lock-in amplifier.
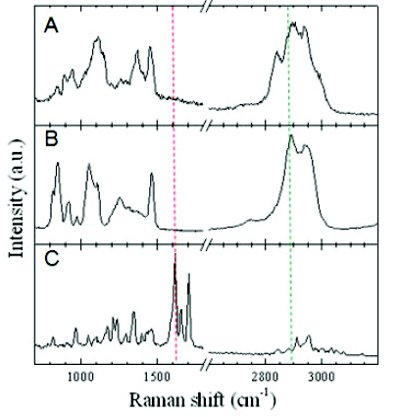 Figure 2. Raman spectra of the components in a film composite. Panels A, B, and C shows the spectra of pure HPMC, glycerol, and griseofulvin, respectively. The dashed lines indicate Raman shift where SRS images were captured. The integration time per Raman spectrum is 10 sec.
The low signal levels of the spontaneous Raman process can be overcome by use of coherent techniques based on coherent anti- Stokes Raman scattering (CARS) and stimulated Raman scattering (SRS). In pharmaceutical applications, CARS microscopy has been used for mapping paclitaxel distribution and dissolution in various drug-eluting stent films [20-22] and for monitoring the solid- state properties of tablets upon drug dissolution [23]. Due to the inherent non-resonant background, most applications of CARS imaging are limited to strong and well-separated Raman transitions, e.g. the C-H stretch vibration. The recently developed stimulated Raman scattering (SRS) microscopy removes the non-resonant background via heterodyne detection [24] and has been shown to provide spectral information identical to spontaneous Raman [25-29]. By making use of MHz frequency modulation to reject the low-frequency laser noise, high-speed and high-sensitivity SRS imaging on the order of few tens of seconds per image of 512 x 512 pixels has been demonstrated [26, 27]. The present work explores the capability of SRS microscopy for high-speed imaging of drug- loaded polymer films and tablets.
Experimental Section
A schematic of the setup used in this study is shown in Fig. 1. The pump and Stokes beams are provided by two 5-ps lasers synchronized and collinearly combined into an inverted confocal microscope. A computerized large-area scanning stage was used for mosaic mapping. The pump beam intensity was modulated by a Pockels cell at 1.13 MHz frequency. The two beams were focused onto the sample using a 10× (numerical aperture (N.A.) = 0.40) or 20× (N.A. = 0.75) air objectives. The forward signal was collected by an air condenser (N.A. = 0.55). The back scattered signal (epi) was collected by the same objectives. A polarization beam splitter, installed in a standard microscope cube separates the polarization- scrambled back-scattered beams from the linearly polarized excitation beams. The Stokes beam was selected by a 850/90 nm bandpass filter and detected by a large area photodiode. A Lock- in amplifier was used to detect the stimulated Raman gain signal with a time constant of 100 μs. The output channel of the lock-in amplifier was positively biased to avoid the feeding of a negative signal into an analog to the digital converter, which had a range from 0 to 5 V. SRS images were acquired with 200 μs/pixel dwell time, resulting in a total of 53 sec per 512×512 image. Confocal Raman microspectroscopy was realized by mounting a spectrometer to the side port of the microscope as reported previously [28].
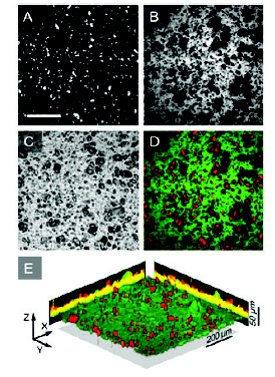 Figure 3. SRS images of API and excipients within a film strip. (A) SRS image obtained at 1614 cm-1. (B) SRS image obtained at 2890 cm-1. (C) Transmission image. (D) Corresponds to the overlaid images A and B and shows the distribution of griseofulvin, as spatially dispersed particles (in red), against the distribution of MCC/glycerine (green background). (E) Three dimensional image reconstructed from 34 frames taken with 2 μm step in Z direction. The multiple smaller API particles inside film result in yellow color in X and Y projections.
Samples
The chemical imaging setup was used to map the chemical distribution in drug-loaded polymer films and in tablets. The films investigated in this study were composed of 9.30% griseofulvin (active pharmaceutical ingredient, API), 69.74% hydroxypropyl methylcellulose (HPMC), 0.02% sodium dodecyl sulfate surfactant SDS), and 20.94% glycerol as plasticizer. The films were flattened between two cover glasses for forward-detected SRS. For the tablets, an amlodipine besylate (AB) tablet (5 milligrams) was directly placed on the coverslip for epi-detected SRS. The tablet excipients consisted of microcrystalline cellulose (MCC), dibasic calcium phosphate anhydrous (DCPA), sodium starch glycolate (SSG) and magnesium stearate (MS).
Results and Discussion
SRS Imaging of Pharmaceutical Film
Distribution of griseofulvin particles embedded in a pharmaceutical film was mapped by SRS based on 1615 cm-1 peak of pure griseofulvin (see Fig. 2C). The film excipients were mapped at 2890 cm-1 where both HPMC and glycerol have strong C-H stretching modes but griseofulvin lacks Raman bands. The SRS images clearly discriminate between the drug particles and excipients (Fig. 3A-B), in opposite to low contrast in the transmission image (Fig. 3C). Each image has 512×512 pixels and was acquired within 53 sec. The film content exhibits uniform intensity, indicative of good mixing of HPMC and glycerol film. The overlaid image of griseofulvin particles and excipients (Fig. 3D) shows some dark areas that suggest the presence of surface roughness. In order to obtain the film surface morphology, we performed depth scan of total 34 images with step size of 2 μm in Z direction. The three dimensional image of the same film area as in Fig. 3D together with the X and Y projections is shown in Fig. 3E. The obtained information can be used to calculate important parameters as particle size distribution, homogeneity of the mixture and film morphology.
 Figure 4. SRS images of API and excipients within a tablet. (A) Photograph of the tablet with fl at surface area indicated by dashed line. (B) Raman spectra of powders of MCC (green), DCPA (blue), AB (red), SSG (dark yellow) and MS (magenta), from top to bottom respectively. (C) SRS mosaic image obtained at 2900 cm-1 (C-H stretching band, green), 1650 cm-1 (AB C-C stretching band, red) and 985cm-1 (DCPA P-O stretching band, blue). The dashed lines in (B) indicate corresponding Raman shifts. (D) Enlarged area inset in C (5.5 μm spacing between pixels). (E) Higher resolution image of dashed area shown in D.
Large Area SRS Imaging of a Tablet
SRS imaging of API and excipients of a whole tablet is presented in Fig. 4. The digital picture of a tablet containing amlodipine besylate as the API is shown in Fig. 4A. The tablet of 26 mm2 surface area was imaged based on known Raman spectra of the pure components are shown in Fig. 4B. The overlaid SRS image of the API and other components (measured at 1615 cm-1, 985 cm-1 and 2900 cm-1), shown in Fig. 4C, was obtained by stitching of 120 SRS images (40 images for each Raman shift). Each mosaic has ca. 1 mm2 field of view and 5.5 μm spacing between pixels. The total acquisition time was 30 min. Fig. 4D shows a single mosaic. Fig. 4E shows a higher resolution SRS image of small area of the tablet with all components displayed. The distribution of magnesium stearate (magenta) was obtained from two SRS images by deconvolution based on the known ratios of Raman intensities at 2850 cm-1 and at 2900 cm-1 for MCC, DCPA, and MS. The distribution of SSG (orange) was imaged at 840 cm-1 Raman shift. The pump and Stokes beams’ powers at the sample were 20 mW and 15 mW, respectively. The SRS image of whole tablet in Fig. 4C, demonstrates the composite nature of the compact, with the distribution of components showing some areas with higher DCPA density and other areas with higher density of MCC and other excipients. Fig. 4C - 4E also show the variation in particle size of the API (red). Such variation in components’ distribution shows the significance of large area analysis enabled by the high speed of SRS chemical imaging. The significant improvement in speed is achieved by stimulated scattering and by spectral focusing on the single Raman band.
Conclusions
We have shown the applicability of SRS-based chemical imaging for the characterization of pharmaceutical systems including drug-loaded films and tablets. The analysis technique presented here provides three-dimensional spatial resolution with the capability of mapping the entire dosage form (e.g., whole-tablet). SRS offers a fast imaging speed that is close to that of NIR chemical imaging and provides the chemical selectivity and spatial resolution of Raman imaging. SRS microscopy has several potential pharmaceutical applications, including evaluation of particle size, structural integrity, and content uniformity of the API and excipients in pharmaceutical solid dosage forms. The high imaging speed of SRS microscopy offers also a powerful analysis method for stability studies (chemical degradation), as well as for the study of drug release dynamics.
Acknowledgments
This work is supported by NIH R01EB7243 to JXC and NSF/ERC Engineering Research Center for Structure Organic Particulate Systems to RP.
References
- Pharmaceutical Quality for the 21st Century: A Risk-Based Approach. FDA, 2004.
- L. Zhang, M.J. Henson, S.S. Sekulic, Multivariate data analysis for Raman imaging of a model pharmaceutical tablet. Analytica Chimica Acta 545(2) (2005) 262-278
- G. Reich, Near-infrared spectroscopy and imaging: Basic principles and pharmaceutical applications. Adv. Drug Delivery Rev. 57(8) (2005) 1109-1143.
- M.A.T.M.A.K. Rakhi B. Shah, Process analytical technology: Chemometric analysis of Raman and near infra-red spectroscopic data for predicting physical properties of extended release matrix tablets. J. Pharm. Sci. 96(5) (2007) 1356-1365.
- L. Maurer, H. Leuenberger, Terahertz pulsed imaging and near infrared imaging to monitor the coating process of pharmaceutical tablets. Int. J. Pharm. 370(1-2) (2009) 8-16.
- S. Šašić, An in-depth analysis of Raman and near-infrared chemical images of common pharmaceutical tablets. Appl. Spectrosc. 61(3) (2007) 239-250.
- A.A. Gowen, C.P. O’Donnell, P.J. Cullen, S.E.J. Bell, Recent applications of Chemical Imaging to pharmaceutical process monitoring and quality control. Eur J Pharm Biopharm 69(1) (2008) 10-22.
- S.J. Hudak, K. Haber, G. Sando, L.H. Kidder, E.N. Lewis, Practical limits of spatial resolution in diffuse reflectance NIR chemical imaging. NIR news 18(6) (2007) 6-8.
- J.M. Amigo, C. Ravn, Direct quantification and distribution assessment of major and minor components in pharmaceutical tablets by NIR-chemical imaging. European Journal of Pharmaceutical Sciences 37 (2009) 76-82.
- J. Breitenbach, W. Schrof, J. Neumann, Confocal Raman-spectroscopy: Analytical approach to solid dispersions and mapping of drugs. Pharm. Res. 16(7) (1999) 1109-1113.
- L. Sage, Raman Microscopes. Anal. Chem. 81(9) (2009) 3222-3226.
- M. Bowden, D.J. Gardiner, G. Rice, D.L. Gerrard, Line-Scanned Micro Raman-Spectroscopy Using a Cooled Ccd Imaging Detector. J. Raman Spectrosc. 21(1) (1990) 37-41.
- M. Delhaye, P. Dhamelincourt, Raman microprobe and microscope with laser excitation. J. Raman Spectrosc. 3(1) (1975) 33-43.
- G.J. Puppels, M. Grond, J. Greve, Direct Imaging Raman Microscope Based on Tunable Wavelength Excitation and Narrow-Band Emission Detection. Appl. Spectrosc. 47(8) (1993) 1256-1267.
- W.H. Doub, W.P. Adams, J.A. Spencer, L.F. Buhse, M.P. Nelson, P.J. Treado, Raman chemical imaging for ingredient-specific particle size characterization of aqueous suspension nasal spray formulations: A progress report. Pharm Res. 24(5) (2007) 934-945.
- D. Zhang, J.D. Hanna, Y. Jiang, D. Ben-Amotz, Influence of Laser Illumination Geometry on the Power Distribution Advantage. Appl. Spectrosc. 55(1) (2001) 61-65.
- S. Schlucker, M.D. Schaeberle, S.W. Huffman, I.W. Levin, Raman Microspectroscopy: A Comparison of Point, Line, and Wide-Field Imaging Methodologies. Anal. Chem. 75(16) (2003) 4312-4318.
- S. Sasic, D.A. Clark, Defining a strategy for chemical imaging of industrial pharmaceutical samples on Raman line-mapping and global illumination instruments. Appl. Spectrosc. 60(5) (2006) 494-502.
- J.X. Cheng, A. Volkmer, X.S. Xie, Theoretical and experimental characterization of coherent anti-Stokes Raman scattering microscopy. J. Opt. Soc. Am. B: Opt. Phys. 19(6) (2002) 1363-1375.
- E. Kang, H. Wang, I.K. Kwon, J. Robinson, K. Park, J.-X. Cheng, In Situ Visualization of Paclitaxel Distribution and Release by Coherent Anti-Stokes Raman Scattering Microscopy. Anal. Chem. 78(23) (2006) 8036-8043.
- E. Kang, J. Robinson, K. Park, J.X. Cheng, Paclitaxel distribution in poly(ethylene glycol)/poly(lactide-co-glycolic acid) blends and its release visualized by coherent anti-Stokes Raman scattering microscopy. J. Controlled Release 122(3) (2007) 261-268.
- Eunah Kang, H. Wang, I.K. Kwon, Y.-H. Song, K. Kamath, K.M. Miller, J. Barry, J.-X. Cheng, K. Park, Application of coherent anti-stokes Raman scattering microscopy to image the changes in a paclitaxel-poly(styrene-b-isobutylene-b-styrene) matrix pre- and post-drug elution. J. Biomed. Mater. Res. A 87A(4) (2008) 913-920.
- M. Windbergs, M. Jurna, H.L. Offerhaus, J.L. Herek, P. Kleinebudde, C.J. Strachan, Chemical imaging of oral solid dosage forms and changes upon dissolution using coherent anti-Stokes Raman scattering microscopy. Anal. Chem. 81(6) (2009) 2085-2091.
- M.D. Levenson, S.S. Kano, Introduction to Nonlinear Laser Spectroscopy, Academic Press, San Diego, 1988.
- E. Ploetz, S. Laimgruber, S. Berner, W. Zinth, P. Gilch, Femtosecond stimulated Raman microscopy. App. Phys. B 87(3) (2007) 389-393.
- C.W. Freudiger, W. Min, B.G. Saar, S. Lu, G.R. Holtom, C. He, J.C. Tsai, J.X. Kang, X.S. Xie, Label-Free Biomedical Imaging with High Sensitivity by Stimulated Raman Scattering Microscopy. Science 322(5909) (2008) 1857-1861.
- P. Nandakumar, A. Kovalev, A. Volkmer, Vibrational imaging based on stimulated Raman scattering microscopy. New J. Phys. 11 (2009) 033026.
- M.N. Slipchenko, T.T. Le, H. Chen, J.-X. Cheng, High-speed vibrational imaging and spectral analysis of lipid bodies by compound Raman microscopy. J. Phys. Chem. B 113(21) (2009) 7681-7686
- Y. Ozeki, F. Dake, S.i. Kajiyama, K. Fukui, K. Itoh, Analysis and experimental assessment of the sensitivity of stimulated Raman scattering microscopy. Opt. Express 17(5) (2009) 3651-3658.
Author Biographies
Mikhail Slipchenko is currently a Research Scientist at Department of Biomedical Engineering, Purdue University (West Lafayette, IN). He obtained his Ph.D. in Chemistry from University of Southern California. His current responsibilities include stimulated Raman scattering microscopy development and application to pharmaceutical samples. His research expertise includes nonlinear and linear spectroscopy and optical microscopy.
Bo Zhou is currently a Ph.D. student at Department of Industrial and Physical Pharmacy, Purdue University (West Lafayette, IN). Her research is focused on the development of novel dosage forms. She received her Master’s degree in 2006 from department of Agricultural and Biological Engineering at Purdue University with her dissertation on physical properties of biomass particles in relation to their handling.
Rodolfo Pinal is Associate Professor of Industrial and Physical Pharmacy at Purdue University. Before Purdue, he worked for over 13 years in the pharmaceutical industry in the areas of preformulation, formulation and physical characterization of solids. Current research interests focus on the solubility, solubilization techniques and formulation strategies for improving the bioavailability of poorly soluble drugs. An important part of his research focuses on the microstructural evolution of composite and processed materials.

Dr. Carvajal's research focuses on materials science with emphasis on surface properties and interactions; manufacturing science; and strategies for formulations for oral and dry powder for inhalation (microfabrication of particles). Prior to joining Purdue University, Dr. Carvajal worked in the pharmaceutical industry for 13 years at Hoffmann-LaRoche and Bayer Pharmaceuticals. She gives seminars in conferences and short courses to industry on various topics in Powder Technology in the USA, Europe and Latin America.
Ji-Xin Cheng is currently an associate professor of Biomedical Engineering at Purdue University. His research lab develops novel optical imaging tools and nanotechnologies for challenging applications in biomedicine such as early detection of tumor spread, characterizing the pathology of demyelination, nerve repair after traumatic spinal cord injury, and drug delivery.