Abstract
Blend monitoring using a spectroscopic probe inserted into a tablet press feed frame is an emerging PAT application. Previous studies have demonstrated the feasibility of monitoring the uniformity and potency of the powder circulating within the feed frame. It has the potential to enable real time release content uniformity testing and control with the integration of tablet press control systems.
Due to the movement of powder within the feed frame, the physical properties variation of the blend is pronounced. In order to further develop the feed frame monitoring approach into a robust application, sample presentation is a critical aspect that needs to be examined and controlled. Studies have been conducted using specially designed devices to provide fundamental understanding on sample presentation. The movement of powder, the implementation of the near infrared (NIR) probe, and the resulting impact on the spectral interpretation are discussed. The studies show that with the optimized probe distance, suitable spectral preprocessing and averaging, the oscillation caused by the moving dynamic can be significantly reduced. Additionally, the potency profile of a 4% drug loading formulation was successfully obtained from feed frame and had good correlation with the stratified tablet sample results.
Introduction
Process analytical technology (PAT) has been an important initiative for the pharmaceutical industry [1]. The role of PAT changes for drug products at different stages. The development stage often requires approaches that have fast turnaround time and low initial effort to provide adequate information for process understanding. Once the product is transferred to the commercial manufacturing stage, the accuracy and robustness of the methods are critical to ensure product quality and potentially for real time release applications. For both of the stages, on-line approaches are often preferred for the rapidness and in-situ information.
NIR spectroscopy for potency analysis is one of the most widely used PAT applications for solid dosage forms such as tablets. This is often achieved by on-line or off-line NIR analysis on the tablet cores [2-4]. For the on-line approach, tablet samples are automatically transferred, by a specialized tablet handling system, from the discharge of a tablet press to a stationary tablet holder for the spectral collection. This process
ensures the consistency and repeatability of sample presentation to the instrument, and acceptable spectral signal-to-noise ratio. However, often there is a considerable lag time between the tablet sampling and subsequent analysis.
Tablet feed frame monitoring has been an emerging technology in very recent years. Previous case studies have shown the feasibility of monitoring the potency of drug product in feed frame by NIR probe [5]. Instead of scanning the tablet cores out of the tablet press, the probe monitors the final blend circulating within the feed frame of the tablet press. This approach enables real-time 100% inspection with potential feedback or feed forward control, which is especially important for continuously manufacturing. Additionally, this technology can be applied to different solid dosage formulations (e.g. direct compression or dry granulation) and product images (e.g. standard round or capsular shaped tablets).
It is well understood that NIR spectra contain information about both the physically properties such as particle size, powder density and the chemical properties of the sample [6]. A successful and robust quantitative method requires both optimal measurement conditions and consistent sample presentation. In comparison to the tablet measurement, the most challenging technical aspect for tablet press feed frame monitoring is the sampling presentation under a highly agitated environment. The movement of powder within the feed frame results in a highly noisy spectral profile. Optimizing the sample presentation to the probe is crucial to decoupling the actual potency variation from the physical properties changes and spectral noise within the system.
Experimental
A nine station rotary tablet press with a powder force feeder was used for each experiment. A diode array NIR instrument equipped with a contact probe was used for NIR data collection. The probe was mounted to the feed frame as shown in Figure 1.

A micrometer was designed to accurately control the distance of the probe tip to the paddle wheel. The probe was firstly inserted into the feed frame to be in contact of the upper surface of the paddle wheel. This position is set as zero. The probe could then be accurately moved up with an accuracy of 1/1000”. Once the powder was put into the system, the probe tip was in contact with the circulating powder blend and was above the rotating feed frame paddle wheels with a distance controlled by the micrometer. The exposure time was set as 25ms for a single spectrum. The total acquisition time for a spectrum is about 30ms including the communication to the computer. The spectra were continuously acquired in order to fully understand the high speed dynamic inside of the feed frame.
Experiment 1. Sample Presentation Understanding
The first set of experiments was designed to understand the empirical interrogation depth of the probe and the noise pattern caused by the movement of powder within the feed frame utilizing a customized plastic paddle wheel.
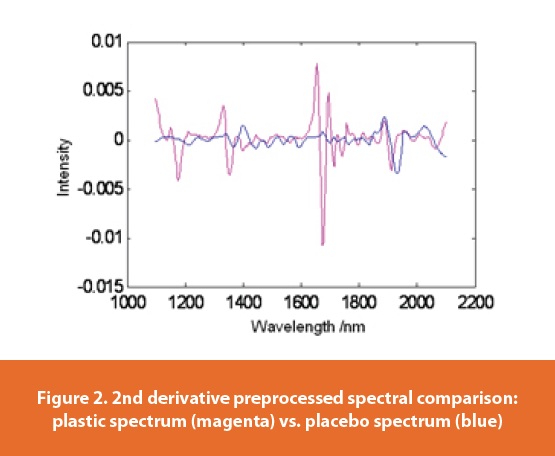
A standard placebo blend, containing 2:1 ratios of microcrystalline cellulose (MCC), lactose, and magnesium stearate (1%), was used as the material that ran through the feed frame. A customized plastic paddle wheel that had distinct spectral features in contrast to the placebo blend was used instead of the regular stainless steel paddle wheel (Figure 2). The plastic peak at 1660nm mimics the common aromatic C-H band in APIs, therefore the plastic spectral feature can be used as a spectral marker to gauge the penetration depth and agitation events in relation to the paddle speed. The probe distance to the paddle was varied from 25, 50 to 100/1000”. For each distance, the data was collected with 10, 25 and 40RPM paddle speed respectively.
Experiment 2. A Trial Run of an Active Formulation
A trial study was conducted with a 4% drug load active formulation. The major excipients are MCC and lactose in 2:1 ratio. A 70% of target potency blend was layered into the feed frame, and a 130% of target potency blend was layered above it in the hopper. This technique was used to generate a dynamic potency change within the feed frame. A standard stainless steel paddle wheel was used for this run. The paddle speed was set as 25 RPM. The probe distance was pre-optimized for the paddle wheel setting using placebo blends and controlled at 25/1000” for the active run. The exposure time was 25ms. 10 scans were averaged to obtain one spectrum for recording. The 200 mg weight tablet cores were bi-convex round shape. Stratified samples were taken across the run. The stratified tablet cores were then analyzed by an off-line NIR spectrometer with a pre-established calibration model to provide reference potency results for the NIR probe profile.
Results and Discussion
Sample Presentation - Oscillation Patterns
Initially, the probe distance was set to 25/1000” from the paddle wheel. At this close distance, the probe was able to penetrate through the thin powder layers to obtain the plastic signal. When a plastic finger passed beneath the probe, the plastic signal was presented in the spectrum collected during this time interval. The intensity of the plastic signal varied depending on the dwell time of the plastic finger beneath the probe during spectrum collection. Therefore, a clean placebo spectrum was obtained when there was no finger passed by the probe, during spectrum collection.
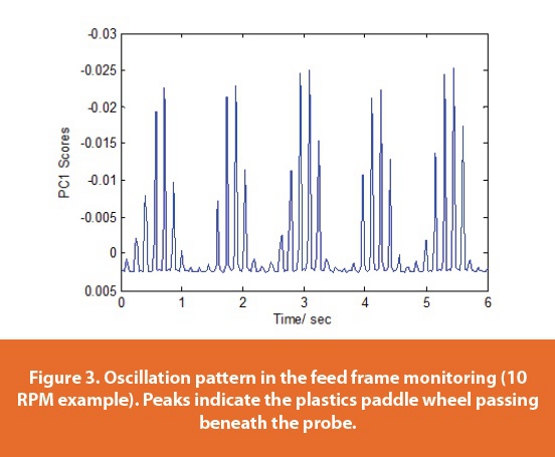
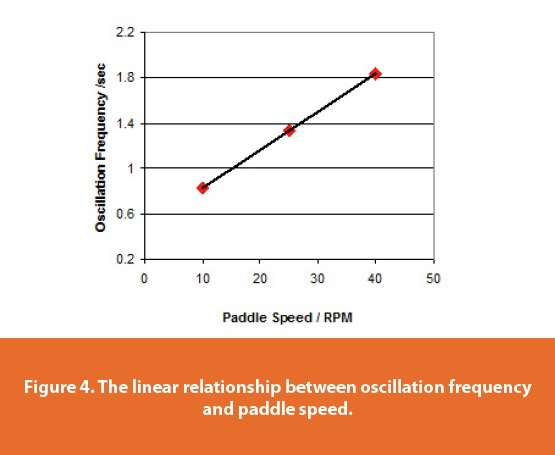
A PCA analysis was conducted on the 25/1000” probe distance dataset for 10, 25 and 40 RPM respectively. PC1 clearly captured the difference between placebo and plastic signal. A score plot of PC1 then captured the paddle wheel events (Figure 3). Figure 3 shows that the oscillation (plastic peaks due to paddle wheel) periodically appeared. The oscillation frequency (peak group per second) varies with the paddle speed in a linear relationship as shown in Figure 4. This indicates that the spectral signal can be safely averaged to smooth out the agitation effect without losing concentration change information. Advanced digital filter may also be developed, however this is not discussed in this paper.
Sample Presentation - Interrogation Depth
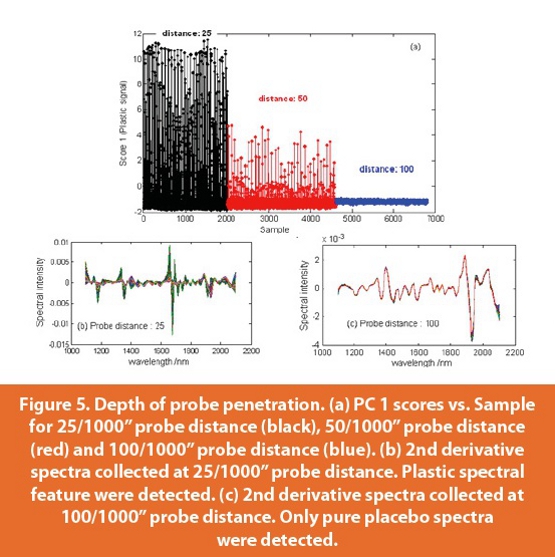
Figure 5 shows the score plot at 25, 50 and 100/1000” probe distance when the paddle speed was kept at 25 RPM. As the probe is moved away from the paddle wheel, the plastic signal became weaker. When the probe was at 100/1000” from the paddle wheel, the plastic signal disappeared and only pure placebo spectra were obtained. The spectra confirmed that the probe was not able to penetrate through the blend to obtain the plastic signal. Therefore, the empirical interrogation depth for this feed frame setting can be determined as 100/1000”. This technique can be used to determine sample interrogation volume for a given formulation.
The Active Trial Study
Probe Distance Optimization
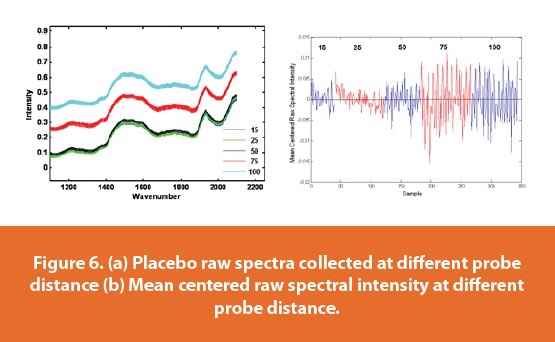
The optimal probe distance should provide the most consistent spectra for a given system. This optimal probe distance may be different for different feed frame configurations and/or paddle wheel designs and material of construction. For the next set of trials, paddle wheels made from stainless steel were used. Figure 6 demonstrates the probe distance impact on the raw placebo spectra. There was no significant raw spectral intensity change until the probe moved away beyond 50/1000” (Figure 6a). Additionally, the raw spectral intensity variation within a run were minimal for 15 -25/1000” (Figure 6b). Using these results, the probe distance was set as 25/1000” for the active trial run to achieve a more consistent presentation of powder to the probe.
Raw Spectral Profile of the Active Run
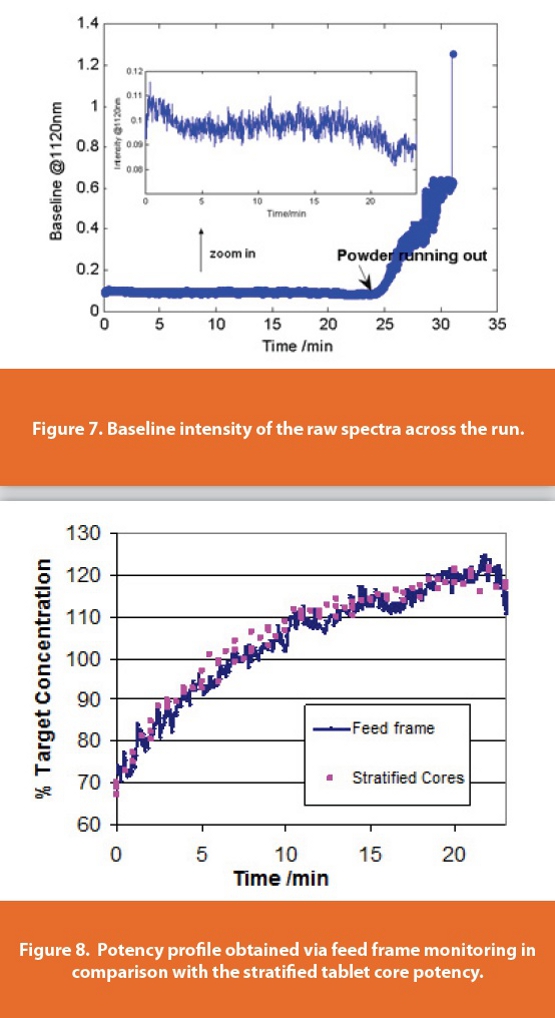
The raw spectral profile was firstly examined for this active run. The intensity of 1120nm was plotted against time. It showed that towards the end of the run, the intensity of the raw spectra had a dramatic change due to the density change inside of the feed frame as the powder emptied out of the system. For a significant change like this, spectral preprocessing can not fully process the variation out. Therefore, the potency profile from the probe of this stage is not reliable at the very end of operation.
The Potency Profile of the Active Run
The spectra of the steady state were then preprocessed by Savitzky- Golay 13pts 2nd derivative to reduce the baseline change caused by small physical density change. An average of 12 blocks (3.64 seconds) was then applied to the spectral data potency profile to reduce the oscillation pattern. A PCA analysis was conducted on the combined dataset of the active run and the placebo spectrum. The add-in placebo spectrum ensured the API concentration information was captured by the first PC. The PC1 scores were then normalized to the off-line stratified core profile for comparison. Figure 8 is the overlay of the potency profiles obtained by the probe and the stratified cores, which showed that the potency trends of the two approaches matched very well. The variation from the probe was comparable with the off-line stratified cores because the signal oscillation was significantly reduced by optimizing the probe distance, data preprocessing and averaging.
Conclusion
The movement of powder causes sample presentation variation in the feed frame monitoring. Understanding the sample presentation is critical to achieve a robust and accurate NIR method. The paddle agitation has a periodic impact on the spectra signal and the frequency of the oscillation is linear to the paddle wheel speed (RPM). The probe location can be optimized to reduce the physical density change caused by the agitation. For a given experimental setup, the interrogation depth needs to be empirically determined. The understanding of the sample presentation combined with suitable spectral pretreatment can then be applied to the routine feed frame monitoring to achieve more robust results.
Acknowledgements
The authors would like to thank Angela Kong, Ashwin Jain and Goldi Kaul for their support on the trial run; Will Ward, Koji Muteki, Hugh Clarke, and Mark Polizzi for their initial effort on championing the feed frame monitoring technology.
References
- Food and Drug Administration (FDA), Guidance for Industry: PAT — A Framework for Innovative Pharmaceutical Development, Manufacturing, and Quality Assurance, Rockville, MD, Sept. 2004
- Neville W Broad, Roger D Jee, C Moffat, Mark R Smith, Application of transmission near-infrared spectroscopy to uniformity of content testing of intact steroid tablets, The Analyst 126 (12), 2207-2211(2001)
- Marcelo Blanco, Manel Alcalá, Content uniformity and tablet hardness testing of intact pharmaceutical tablets by near infrared spectroscopyA contribution to process analytical technologies, Analytica Chimica Acta 557 (1-2), 353-359 (2006)
- Yang (Angela) Liu, George L. Reid, Zhongli Zhang, Chapter 15. No sample preparation, Beverly Nickerson, Sample Preparation of Pharmaceutical Dosage Forms: Challenges and Strategies for sample preparation and extraction, Springer , New York(2011)
- Daniel Blackwood, Mark Polizzi, Hugh Clarke and Howard Ward, Determination of Blend Uniformity and Potency in the Feed Frame of a Tablet Press Using NIR Spectroscopy, IFPAC, Baltimore, Maryland, January 2011
- Donald A. Burns, Emil W. Ciurczak, Handbook of Near-Infrared Analysis, Third edition, CRC Press, 2007
Author Biographies
Dr. Yang Liu is a Principal Scientist at Pfizer Worldwide Research & Development, Groton, CT. She received her M.Eng. in Chemical Engineering from Zhenghzhou University and her Ph.D. in Analytical chemistry from Wuhan University, China. After a postdoctoral research in Laboratory of Chemometrics at University of Delaware, Dr. Liu has joined Development Analytics division at Pfizer, where she has focused on process analytical technology development for new drug product process understanding and real time release. Dr. Liu has more than 10 years experiences on industrial spectroscopic applications.
Daniel O. Blackwood is a Senior Principal Scientist at Pfizer Worldwide Research & Development, Groton, CT. He received his BS in Mechanical Engineering from Cornell University and his MS in Industrial Engineering from Columbia University. During his 17 years at Pfizer, Daniel’s research has focused on developing robust process scale-up models to support the technology transfer of solid, oral dosage forms. Recently, he has focused on developing and implementing innovative continuous manufacturing processes for solid, oral dosage forms.