Abstract
Product development using Quality-by-Design principles, as expressed in ICH Q8 (R2), has yielded a wealth of information at the interface between material science and process science. Using this knowledge to implement process controls in commercial production will ensure consistent product quality. There are two principal methods of process control: control of the equipment and control of the output of each unit operation. Three cases are presented to illustrate the evolution from equipment control towards an attribute based control loop. Finally a brief discussion of the advantages of attribute based process control is presented.
Case 1 uses the attribute knowledge generated during development to determine the parametric control limits for a roller compactor. QbD principles were used to develop the limits for acceptable ribbon density and thickness. The ribbon attributes were used to specify the parameter (roll pressure and gap) control points at a fixed screw speed. The equipment was run at these preset parameter control points. The presumption is that maintaining similar operating conditions would ensure similar intermediate (ribbon) properties.
Case 2 uses equipment measurements as a soft-sensor. During wet granulation in a ribbon blender the power change in response to addition of granulating liquid and time was monitored. QbD principles were used to link granulation properties to the power-time profile. Power is a soft-sensor for the changing powder properties (tackiness, size and density) in the equipment. The power-time profile was used in the control loop as a feedback for liquid addition and wet massing time. Both the rise and absolute power value were used as determinants in the control loop. This is a finger printing approach that presumes that similar operational profiles as determined by the soft-sensor indicate similar intermediate (granule) properties.
Case 3 uses the intermediate attribute limits generated as in-process control limits. QbD principles were used to develop the attribute limits for the blend (uniformity), ribbon (density and thickness) and wet-mass (consistency). Control loops were developed to connect the in-process attribute measurements to the process parameter control points (revolutions, roll pressure and gap, water addition and time).
Case 3 demonstrates that to ensure consistent quality entails developing independent measurement technologies for the intermediates and designing the corresponding feedback control loops. The necessary resultant outcome would be a parameter free process that can be more easily scaled, transferred between different equipment types and is insensitive to equipment changes.
Introduction
A wealth of new information has been produced at the interface between material science and process science by incorporating Quality-by-Design (QbD) principles in product development. The ultimate goal of QbD development is to ensure that a quality product is manufactured consistently in routine commercial production. Much of the effort in QbD has focused on design of experiments and statistical analysis, and included Neural net modeling [1-3]. 
Once a target product profile is established for a product based on the in-vivo performance requirements, the critical quality attributes identified for the product need to be connected to attributes of the various process intermediates produced as part of the manufacturing process [4, 5]. A statistical analysis can be used to define design spaces or operating boundaries for equipment parameters within which a process must run to maintain the desired quality [6].
The current state of practice is to control the equipment parameters within narrow limits with an anticipation of outcome control. The next step in the evolution of process control is to use equipment measurements as soft sensors in feedback control loops. The ultimate in-process control evolution is to use attribute measurements in feedback controls. These three types of process control are depicted in Figure 1.
Controlling the quality of these intermediates ensures the quality of the final product [7]. This evolutionary progression depends on conversion of development information into process knowledge using sound scientific principles and models [8,9]. Using this knowledge, process feedback controls can be designed for commercial production to ensure consistent product quality.
Relying on the consistent operation of equipment presupposes that the quality of the final product is adequately ensured by controlling equipment parameters. Controlling the attributes of process intermediates through feedback loops would inject a degree of certainty to end product quality. Attribute feedback control requires development of functional relationships between intermediate attributes, process parameters and CQAs to obtain a detailed process knowledge. A control strategy requires both a measurement technique that is accurate and sensitive [10-13], as well as a decision tree to ensure proper decisions are made on the data in real time. Therefore attribute based control strategy is at the intersection of process science, material science and measurement science, and represents the desired state of process control.
This article chronicles the evolution from equipment control to feedback control. Future publications will present the details of each measurement technique described.
Materials and Methods
Materials
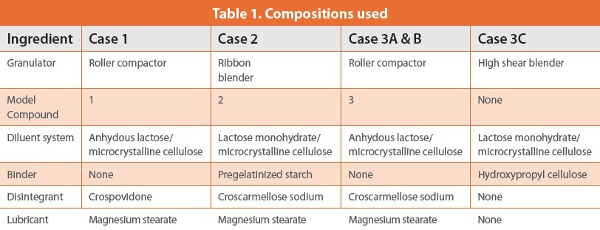
Microcrystalline cellulose, lactose anhydrous and lactose monohydrate were used as diluents. Pregelatinized starch and hydroxypropyl cellulose were used as binders. Crospovidone and croscarmellose sodium were used as disintegrants. Magnesium stearate was used as a lubricant. All excipients were NF/USP grade. Table 1 presents the compositions used.
Methods
In Case 1 a roller compactor was used to granulate a model medium solubility compound with an anhydrous lactose /microcrystalline cellulose system, crospovidone and magnesium stearate. A statistically designed study was used to quantify the effects of roll pressure, roll gap and mill speed on granule properties. The roll speed was held constant at 10 rpm and the upper screen had a 3.15-mm opening and the lower screen had a 1-mm opening. Based on the data the mill speed was set at 60 rpm.
In Case 2, a ribbon blender was used to wet-granulate a model low solubility compound with a lactose monohydrate/microcrystalline cellulose system, croscarmellose sodium and pregelatinized starch (which requires time for activation upon wetting). The powders were blended for approximately 3.5 min at which point water addition was initiated at approximately 1.8 L per min. During wet-granulation the change in main plow power draw (watts) in response to water addition and time was recorded. Post-addition wet massing was continued until a predetermined wattage was obtained.
In Case 3A a bin blender outfitted with a Near Infrared (NIR) detector was used to blend a powder mixture containing a model high solubility compound with an anhydrous lactose/microcrystalline cellulose system, croscarmellose sodium, and magnesium stearate. During the rotation of the bin the blend composition was measured once per rotation. The blend uniformity was calculated as the %RSD over 50 revolutions.
In Case 3B a roller compactor was used to granulate the powder blend from Case 3A. The roll pressure and roll gap were varied according to a statistically designed study. The roll speed was held constant at 10 rpm. The mill speed was set at 60 rpm, the upper screen had a 3.15- mm opening and the lower screen had a 1-mm opening. A caliper was used to measure the ribbon thickness. A sectioning technique was used to determine ribbon density. A contact ultrasound technique was developed to measure the ribbon density off -line using time-of-flight to calculate the ribbon density.
In Case 3C a high shear blender was used to wet-granulate a lactose monohydrate/ microcrystalline cellulose system using hydroxypropyl cellulose as the binder. The powders were blended for 210 sec at which point water addition was initiated at a controlled rate (27 mL/min). The rate and amount of water added was varied according to a statistically designed study. An in-line ball viscometer was used to continuously measure the consistency of the powder bed before addition, during addition and during wet massing. The viscometer was calibrated with water prior to each use and placed below the surface of the powder bed.
Results and Discussion
Case 1: Equipment Control (Roller Compaction)
Case 1 illustrates a control strategy for the equipment that relies on maintaining equipment parameters within pre-determined control limits. The roller compactor unit operation forms ribbons from a powder blend. The ribbons are fed into a mill to produce the granules. Two equipment parameters control ribbon formation (roll pressure, roll gap) at a fixed screw speed. Three equipment parameters control granule formation (mill speed, upper screen, lower screen). 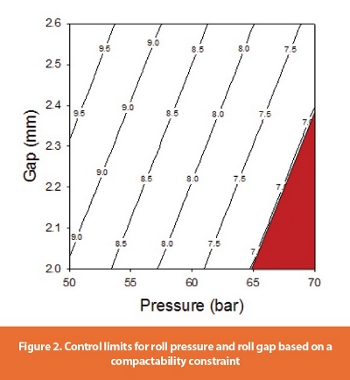 A designed study was used to define the statistical relationships between the granule attributes (granule flow and compactability) and the process parameters (roll pressure, roll gap, mill speed). The statistical relationships were combined with constraints on flow and compactability. An example graphical space is presented in Figure 2. Figure 2 shows the control limits for the roll pressure and roll gap with a constraint of compactability ≥ 7 SCU/ton.
Control of the process in this case relies on the measurement of equipment hydraulic pressure and the gap between the rolls. The control strategy required that the roll pressure and roll gap be adjusted to maintain the parameters within the control limits. The presumption is that maintaining similar operating conditions would ensure similar granule properties. This remains true provided that the same input material properties are used and the same equipment is used. In moving between different models of the same brand of roller compactor the target and control values for roll pressure and roll gap need to be reestablished. Similarly upgrades of firmware and key assemblies would trigger reestablishing parameter control values.
Case 2: Soft sensor (Wet Granulation)
Case 2 illustrates a control loop using equipment measurement (wattage) to monitor the change in powder properties during granulation as a feedback to determine processing conditions (water addition and wet massing time). Pregelatinized starch in a wet granulation process requires time after wetting to activate before becoming active as a binder. The amount of water added to the powder mixture affects the degree of activation. Both the degree of activation and wet-massing time determine the granulation profile by affecting the power draw.
Measuring the motor power (watts) draw for the main blade during wet granulation is a means of characterizing what the wet mass is doing to the machine. The motor draw during dry blending was approximately 400 watts. Upon introduction of water, the motor draw increases as the granules form; the increased power consumption reflects a change in size, tackiness and density. 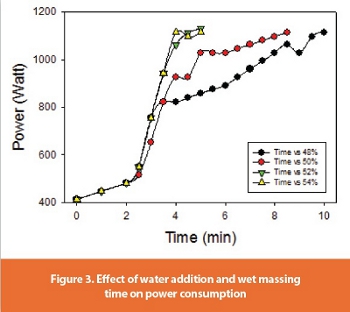 An example granulation profile is reflected in Figure 3 (water addition initiated at 0-min time). Using flow and compactability, the granulation endpoint was predetermined to be 1115 watts. The time required to reach the endpoint wattage decreased with an increase in the amount of water added.
In Case 2, power measurement is a soft-sensor (indirect measure) for the changing powder properties in the equipment. The powertime profile was used in a control loop as feedback for water addition and wet massing time. Both the absolute power value and rise in power (power vs. time slope) were used as determinants in the control loop. The accompanying control logic specified addition of the requisite amount of water and to use wet massing time to reach the granulation endpoint (absolute power value). If the slope did not project reaching the power endpoint, the control logic specified adding more water to increase the slope. Hence, the control logic had to reflect the interactive effect on power of the amount of water added and wet massing time.
This is a finger printing approach that presumes that similar profiles indicate similar granule properties. The measurement and control logic form the feedback control loop for time and water: maximum absolute value to adjust mixing time and slope to adjust liquid amount. Soft sensors must be used with certain constraints to ensure that decisions made from the measurements are valid. To make certain that the measurements are within historical norms, the water amount used must be within a defined range, the same equipment must be used and the powder bed must occupy the same volume fraction. The three constraints limit the motor draw to expected norms and any significant deviation from this range indicates an underperforming process. 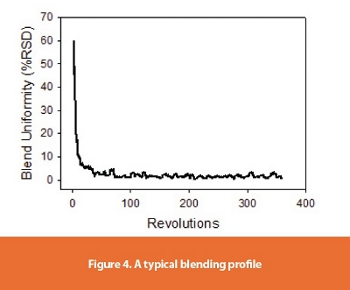 A change in material properties could alter the motor draw without necessarily indicating a changing process. Hence, another constraint is a limited ability to adjust for changing material properties. Since the mechanical properties (e.g. motor efficiency) of two machines can be different, scale-up is not a direct translation between two equipment models. The power measurement is the total energy required to turn the motor, gearbox and impeller. Since the drive train is subject to wear this could lead to a baseline change of the power required to operate the equipment. In addition, baseline changes due to the drive system warming up or changes in seal wear or gear oil viscosity all can affect the power measurement.
Case 3A: Attribute Control (Bin Blending)
The three examples in Case 3 illustrate control loops that use measured attributes of in-process intermediates as feedback to control equipment or process parameters. The efficiency and ability of a bin blender to mix powders to attain a uniform mixture depends on the properties of the individual components of the powder blend and on the shear imparted by the equipment. 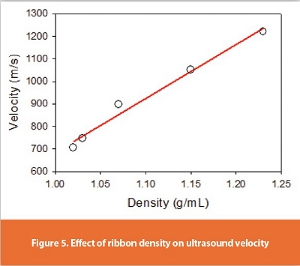 NIR spectral information was used to measure the composition of the blend in-situ once every rotation. The uniformity was calculated as the %RSD over 50 revolutions. A typical blending profile is presented in Figure 4. Control of the process calls for blending to continue until the attribute (uniformity, %RSD) satisfied the limits (less than 5%). This feedback control strategy for blending ensured the high quality of the blend.
Case 3B: Attribute Control (Roller Compaction)
In the roller compactor unit operation ribbons are fed into a mill to produce granules. Control of ribbon properties ensures the quality of the resulting granules. For Case 3B, the ribbon attribute (thickness and density) limits were set using a statistically designed study. The study data was used to define the statistical dependence of granule flow or compactability on ribbon thickness and density. These relationships were used to set control limits for ribbon attributes.
Ribbon thickness was measured using a calibrated caliper. Ribbon density was measured using a sectioning technique. 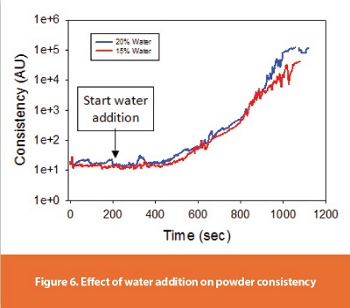 An off-line ultrasound set-up was developed to measure ribbon density to demonstrate the concept. An ultrasound pulse from the emitter traveled through the ribbon to the receiver. Ultrasonic ribbon density determination is based upon the principle that sound travels at different speeds within media with different densities. Ultrasound velocity was used to determine the ribbon density and was verified using the sectioning technique. Figure 5 shows the relationship between pulse velocity and ribbon density. The control strategy for the roller compaction process relies on maintaining the ribbon attributes (thickness and density) within the control limits. The control logic specifies that the roll gap is to be adjusted to modify the ribbon thickness and that the roll pressure is to be adjusted to modify the ribbon density.
Case 3C: Attribute Control (Wet Granulation)
In Case 3C, the transformation of the dry powder from a free flowing material to a tacky wet mass was measured using an in-situ ball viscometer, which was placed below the surface of the powder mass. This instrument measured the consistency of the material during dry blending and water addition. The control limits for the wet mass consistency were predetermined. The powder consistency measurement was used to design a feedback loop to control water addition. The control strategy called for water addition to continue until the predetermined powder consistency control limits were satisfied. The feedback control ensures similar granule properties with varying operating conditions. This feedback control strategy is scale insensitive since the material property (consistency) is measured directly. Figure 6 depicts the change in powder consistency with water addition.
Conclusion
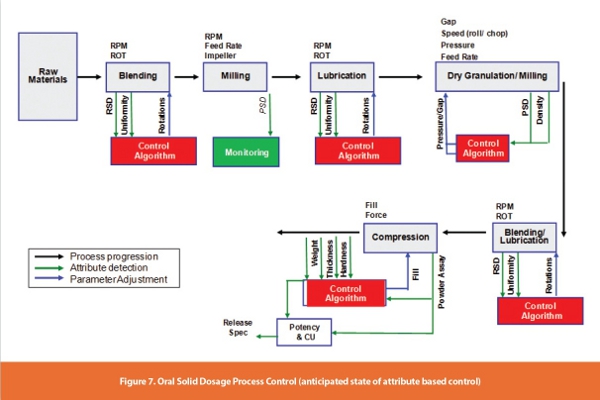
Attribute control strategy relies on maintaining the intermediate (blend, ribbon, and wet mass) attributes within the control limits. The control logic specifies that the process parameters (revolutions, roll gap, roll pressure, water addition and time) are to be adjusted to satisfy the control limits. In moving between different models of the same brand of equipment, the process parameters are adjusted to provide similar attributes. This approach enables the process to react to variances in input material properties by ensuring that intermediates of the requisite quality are produced. It entails developing independent measurement technologies and designing the corresponding feedback control loops (decision trees). Therefore, the necessary resultant outcome would be a parameter free process. Figure 7 depicts such a future state when parameter free processes are controlled through attribute based feedback.
References
- Soh, J.L.P., Boersen, N., Carvajal, M.T., Morris, K.R., Peck, G.E. and Pinal, R. Importance of raw material attributes for modeling ribbon and granule properties in roller compaction: Multivariate analysis on roll gap and NIR spectral slope as process critical control parameters. J. Pharm. Innov. (2007)
- 106-124. 2. Wu, H., White, M., and Khan M.A. Quality-by-Design (QbD): An integrated process analytical technology (PAT) approach for a dynamic pharmaceutical co-precipitation process characterization and process design space development. Int. J. Pharm. (2011) 405: 63-78.
- Dennis, J. Application of Quality by Design (QbD) Principles to Extractables/ Leachables Assessment. Establishing a Design Space for Terminally Sterilized Aqueous Drug Products Stored in a Plastic Packaging System. PDA J. Pharm. Sci. Tech. (2010) 64:527-535
- Rathore, A.S. Roadmap for implementation of quality by design (QbD) for biotechnology products. Trends in Biotechnology (2009) 27: 546-553.
- Rathore, A.S. and Winkle, H. Quality by design for biopharmaceuticals Nature Biotechnology (2009) 27: 26 - 34.
- Huang, J., Kaul, G., Cai, C., Chatlapalli, R., Hernandez-Abad, P., Ghosh, K. and Nagi, A. Quality by design case study: An integrated multivariate approach to drug product and process development. Int. J. Pharm. (2009) 382:23-32.
- Bondi Jr. R.W. and Drennen III, J.K. Quality by Design and the Importance of PAT in QbD in Separation Science and Technology (2011) Volume 10, Chapter 5, Pages 195-224.
- Prpich, A., Am Ende, M.T., Katzschner, T., Lubczyk, V., Weyhers, H. and Bernhard, G. Drug product modeling predictions for scale-up of tablet fi lm coating-A quality by design approach. Computers & Chemical Engineering (2010) 34: 1092-1097
- Hallow, D.M., Mudryk, B.M., Braem, A.D., Tabora, J.E., Lynberg, O.K., Bergum, J.S., Rossano, L.T. and Tummala, S. An example of utilizing mechanistic and empirical modeling in quality by design. J. Pharm. Innov. (2010) 5:193-203
- Depalma, A. PAT Slowly Yielding to Broader QbD. Genetic engineering and biotechnology news (2011): Vol. 31, No. 6.
- Ciurczak, E.W., Ketolainen, J., Laitinen, R., Aaltonen, J. and Linden, H.H. Taking PAT to the next level. Eur. J. Pharm. Sci. (2011) 42:1-2.
- Puchert, T., Holzhauer, C.V., Menezes, J.C., Lochamnn, D. and Reich, G. A new PAT/QBD approach for determination of blend homogeneity: Combination of on-line NIRS analysis with PC scores distance analysis (PC-SDA). Eur. J. Pharm. Sci. (2011) 78:173-182.
- Wu, H. Takakkul, M., White, M. and Khan, M.A. Quality-by Design (QbD): an integrated multivariate approach for the component quantifi cation in powder blends. Int. J. Pharm. (2009) 372: 39-48.
Author Biographies
Omar L. Sprockel, Ph.D., is an associate Director with Bristol-Myers Squibb in Oral Solids Dosage Form development, New Brunswick, New Jersey. He received his B.S. degree in Pharmacy and his Ph.D. degree in Industrial Pharmacy from the University of Georgia. After 6 years as a faculty at the University of Cincinnati, he joined Bristol-Myers Squibb. His early research interest was on polymers and melt extrusion as a means of delivering high loaded polymer disks. More recently, his research eff orts have focused on the implementation of Quality-by-Design in commercial operations through control loop development. Central to this eff ort is the development of novel measurement techniques that enable in-process feedback control.
Douglas Both is an Associate Director at Bristol-Myers Squibb in New Brunswick New Jersey, with more than 25-years of industrial experience. Doug currently leads the Biopharmaceutics Process Analytical Science group within Analytical Bioanalytical Development. In this role his group develops, validates and transfers PAT control strategies to enable Real-time Release testing of drug products entering into commercial production. He received his B.S. and M.A. degrees in Chemistry from Montclair State College. His current interests have been focused on noninvasive analytics, and process feedback and control.