Introduction
Defining Process Analytical Technologies (PAT) is not straightforward, as their use is widespread and wide-ranged. Bakeev defines a PAT as an “analysis of the process…for the improvement of process development and control”. PAT are distinguished from laboratory analysis in the sense that they are faster and require no manual sample handling, hence allowing “the opportunity for live feedback” [1].
One of the many areas of pharmaceutical activities that benefits from the implantation of PAT is final product quality assessment for release to consumers. Quality control testing is a demanding, time-consuming and expensive activity that could benefit from advantages associated with PAT: rapidity to obtain precise and accurate results, lowered long-term cost, decreased maintenance requirements and decreased by-products demand (such as solvents), amongst others.
This article is intended to demonstrate that Raman spectroscopy, a relatively newcomer in the PAT toolbox (when compared to the long-used Near Infrared Spectroscopy – NIRS) can be used with success to measure quality attributes in a tablet.
Raman Spectroscopy
As light is an electromagnetic radiation, it can affect the electron cloud of a molecular bond and make it oscillate, from its original equilibrium position to a higher vibration level and back. When the electron relaxes back to its original energy level, the phenomenon is referred to as Rayleigh scattering. For a small portion of the incident light, an inelastic relaxation occurs; the electron relaxes to a higher or lower level than what it started from, leading to Stokes or Anti-Stokes Raman scattering. When mention of Raman scattering is made, it is generally assumed that it refers to Stokes Raman scattering, where incident light is red-shifted.
 To measure a Raman spectrum, a laser is focused on the sample and light emitted back is collected and filtered to remove the laser wavelength. The remaining light is focused on a dispersive spectroscope that separates the different energies of light before focusing it on the detector that gives results in the appearance of the Raman spectrum. The main advantage of Raman spectroscopy, much alike NIRS, is that there is no need for sample preparation and it is rapid, selective and specific. Moreover, it is not affected by water or packing materials such as clear glass or plastic [1, 2, 3, 4]. Overall schema of the phenomenon is illustrated in Figure 1.
Multivariate Data Analysis and Modeling
Raman spectroscopy results in an amount of data that can rapidly become overwhelming. Even though “univariate analysis is the simplest mathematical approach towards interpreting Raman spectroscopic data” [5], “multivariate methods…that can extract qualitative and quantitative information from the whole spectrum [are often] employed. In [such] analysis, the covariance between the spectral data and known concentration data is maximized to obtain as much information as possible, while unrelated data is neglected. This renders [possible the quantitative analysis of mixtures containing several components]” [6] [5, 7].
Partial Least Square (PLS) analysis “is a regression method, with an x-matrix and y-vector (or matrix [for several y variables]). …It is like [Principal Component Regression – PCR] a projection method and works in a similar manner. The difference is that while PCR captures as much of the variation in x as possible in each component, PLS calculates components that both capture the variation in x and correlates with the variation in y” [8]. “Because Y-data are used in the data compression step, it is often possible to build PLS models that are simpler…, yet just as effective as more complex PCR models built from the same calibration data [Since, generally,] simpler models are more stable over time and easier to maintain” than more complex ones, PLS is usually preferred over PCR at equal performances [1, 5].
Scope
The scope of the present work is to develop multivariate predictive models that would allow obtaining estimations of the content of intact pharmaceutical tablets as accurately and precisely as possible. In the case discussed here, the concentration of 4 minerals has been monitored using RS.
METHODOLOGY
Sample Preparation
Sample preparation protocol must respect the followings criteria and constraints:
- concentration span must cover acceptance limits of product specifications;
- concentration span must allow for detection of possible Out-of-Specification samples;
- very low co-linearity between raw material concentrations in the calibration matrix;
- raw materials not monitored must also include a certain amount of variation to maximize model robustness.
Sample composition was hence planned to satisfy these criteria and constraints. Concentration points of all raw materials to be monitored were decided and then randomly assigned to a powder mix number. Small adjustments were then made to each powder mix formulation to insure that overall mix was possible (addition of individual raw material quantity added to 100 %) and absence of linear correlation was verified.
 Theoretical composition of samples to be prepared is detailed in Table 1, for each sample, in % of composition normally encountered in the commercial product.
This calibration plan allows for minimal correlation for any raw material combination, as detailed in Table 2. In this table, excipient 5 (“Exc. 5”) is listed because it is another major raw material in the formulation and thus the correlation between its concentration and that of Mineral 2 (“2”) was difficult to keep to the required minimum. All other excipients were added as fillers with the same proportion between each other other. The correlation between this group and any other varied raw material is detailed under the entry “other excipients” and was calculated according to Eq. 1, in which a bar denotes the mean.
 Manufacturing of the development samples was made in such manner as to reproduce as closely as possible the actual manufacturing method for commercial product. The order of addition of each raw material, as well as their relative proportion for those added sequentially, have been respected as much as possible. Premixes were made using a mixer equipped with B-flat beater and 4.5L bowl. Powder was then loaded in a 16 qt V-blender and stirred, before lubricants were added and mixed in. Compression was done using a double-feeder 27-stations automatic press. Only one side was used to feed the process and compress the powder, the free side being used for pre-compression with minimum allowable pressure. Punches and matrices for the commercial product could not be used to manufacture the development samples because of technical incompatibilities but punches and matrices with similar specifications were chosen: flat surface with same depth of embossment. Tablet hardness was tested during compression process, with hardness tester, to ensure even tablet manufacturing.
Data Collection
In order to obtain each sample spectra, 5 tablets of a given batch were scanned one time on the middle of each side and the resulting 10 spectra were averaged. This process was repeated 10 times for each batch. Commercial product samples were also scanned in the same manner, for later use at the validation stage.
Spectra were acquired with a Raman spectrometric system, equipped with a 780-nm high power laser, 780 nm Rayleigh filter and full-range grating (400 lines/mm). The selected spectrograph aperture was the 50 μm slit. Acquisition parameters were established as follows for all spectra acquired. Two 10 sec acquisitions were done using 130 mW laser power over a 50 – 3300 range at 0.964 cm-1 steps. Probed volume is estimated at 25 mm3 (5x5x1 mm). Given that 10 spectra are taken for 5 tablets and then averaged, the total volume probed is of 250 mm3, which represents 46 % of one development tablet and 10 % of a commercial unit-dose.  No automatic corrections were applied to the spectra. Raw spectra totalized 3370 measurement points presented on the x-axis as Raman shifts; intensity at each point was reported in counts per second (cps) on the y-axis. An example of an average spectra obtained with the set parameters is given in Figure 2. The overlay of averages for all calibration spectra is presented in Figure 3. These spectra have been treated as will be detailed in further sections.
Reference values were obtained using Wyeth Pharmaceuticals reference method for the commercial product. Five (5) tablets were pooled together to obtain a reference value for Mineral 2, Mineral 1 and Mineral 4 content. Three (3) of the available groups of samples were tested in this fashion. Six (6) other tablets were pooled together to obtain reference values for Mineral 3. Four (4) of the available groups of 5 tablets were tested in this fashion, with the addition of 1 tablet from the fifth group to each one of the four groups. This addition was made in order to obtain enough powder to allow sample processing according to the validated method. The standardized mineral content assessment was made using Inductively Coupled Plasma-Optical Emission Spectrometry (ICP-OES). ICP readings were made with a system that was operated according to a USP-compliant fully validated method, by trained analysts.
Model Calibration
Several pre-treatments were tested in order to obtain the best PLSR possible. Root Mean Square Error of Cross Validation (RMSECV), for a systematic 5 samples-segmented cross-validation, was used as the performance indicator choosing the optimal pre-treatments, which corresponds to the minimal RMSECV. This condition has been obtained with the combination of a linear baseline correction and normalization.
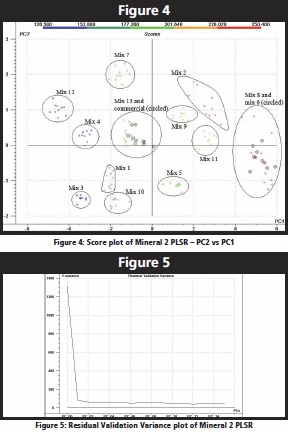 The presence of outliers in the spectra was investigated independently for each calibration (mineral). Preliminary PLS models were calculated and score-, regression-, and leverage-plots were examined. Then, the points identified as potential outliers were removed from the data set and a new PLS regression was performed in order to confirm that removal of the suspected outlier had improved model performance. Mineral 2 calibration score plot (PC2 vs PC1) displayed in Figure 4 is a good example of outlier diagnostic plots. In this plot, each point represents the projection of one sample spectra in a 2D PC-space, and the coloration is concentration-correlated, from blue to red. All samples but those from mixes 6 and 8 are well grouped and separated. Mix 6 and 8 have similar Mineral 2 concentration and their entwinement is to be expected. This score plot tends to indicate that the first PC is strongly correlated to Mineral 2 concentration.
For Mineral 1 and Mineral 3, several outliers were found in the data and careful removal also allowed regression optimization.
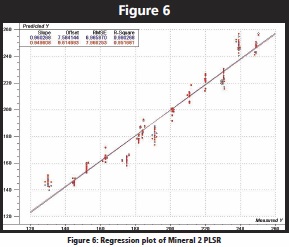
The plot of Residual Validation Variance as a function of the number of PCs used in the PLSR is a good indicator of the number of PC to include in the PLSR. Refer to Figure 5 for an example using Mineral 2 data. It is recommended to select the number of PCs used in the regression as the number where a sudden drop is encountered, augmented by one. For Mineral 2 calibration, the use of 2 PCs allows explaining 89 % of the X-variances and 96 % of the Y-variance. For Mineral 1 and Mineral 3, respectively 2 and10 PCs allowed explaining 88 and 99.9 % of the X-variances and 93 and 99.9 % of the Y-variance.
 The regression plot illustrates the fit between the predicted and the measured Y-variable values during the cross-validation calculations. An example with Mineral 2 data is provided in Figure 6. For the Mineral 2 PLSR, an R2 c of 0.96 and an R2 v of 0.95 indicates that good validation results can be expected. For Mineral 1, the calibration correlation was of 0.93 and the validation correlation was of 0.92. For Mineral 3, the correlations were 0.99 and 0.89.
For Mineral 4, the calibration showed the presence of significant hurdles. With a concentration lower than 0.25 % in the commercial tablet, the presence of characteristic peaks in the pure raw material was found to be insufficient to lead to a robust regression. In this case, changing the monitoring approach for this mineral, for example working on premixes, could potentially allow obtaining a statistically acceptable regression. However, as of today, no tests were made to confirm or infirm this assumption.
As can be observed by the very good accuracy and repeatability recorded in Table 3, the use of the previously described PLS regression to predict the values of the samples in the validation matrix leads to promising results. Accuracy of the models was computed according to Eq. 2, taken from validation of an ICP method. In Eq. 2, refers to predicted values; y refers to theoretical values; and N indicates the total number of samples. Repeatability was computed using Eq. 3.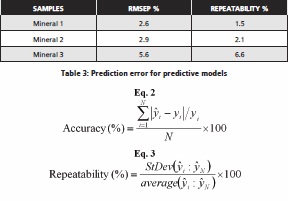
Discussion
In this section, the performances of the models and the choice made for the calculation basis of the RMSEP are discussed.
When assessing the performance of the models, the natural comparison basis is the currently used method, ICP in this case. The measure of ICP performance was taken from the validation data of the method. Accuracies for the 3 mineral are better than 1 % and repeatability are all equal to 1 %. These numbers were calculated using respectively 3 triplicates and 6 replicates. The acceptance criteria for method accuracy and repeatability were respectively 10 and 5 %.
It can be observed that the accuracy criterion is respected for the 3 minerals for which predictive models could be developed. Repeatability is a problem concerning Mineral 3 prediction only. However, given that the data used to calculate those performances does not come from “standard” samples (i.e. they were obtained from commercial samples for which only pooled values, not individual values, where available), it can be anticipated that further testing using individual samples values would reveal better performances.
The results obtained with the developed PAT method are promising but formal validation remains to be done. Moreover, a larger amount of commercial samples and development standards need to be used in order to properly assess whether this RS-based PAT method is equivalent to the ICP-based one.
Conclusion
In this article, a multivariate analysis method was adopted to develop predictive models allowing the quantification of 4 minerals in intact pharmaceutical tablets, based on their Raman spectra. Three (3) out of those four (4) models showed promising performances in terms of accuracy and repeatability. The fourth mineral was found to be problematic to allow for adequate quantification in the case at hand. Nevertheless, there are appropriate indications that a change of the measurement approach for this particular raw material would lead to more promising conclusions. For example, it could be suggested to proceed to the monitoring of this mineral during the mixing steps, a point at which the concentrations would be higher. The feasibility of this proposition is yet to be demonstrated.
The positive conclusion of this work is that the performances of the developed RS-based methods in predicting the concentration of 3 minerals in commercial solid dosage pharmaceutical product are promising.
Potential gains in implementing this PAT in replacement of a traditional wet-chemistry based method are numerous, including but not limited to, time and cost savings, possibility of increased and even real-time at-line monitoring and, of course, real-time release testing.
Furthermore, using a method that requires no sample preparation at all has a great potential to lower experimental errors and risks associated with the use of solvents and, consequently, accidents. Although they are hard to associate with a tangible cost, those last advantages remain very important and could tip the balance toward implementation of more and more RS-based testing methods.
The kind contributions of Anne-Marie Demers (M.Sc.A student) and late Jasmin Groleau, during development sample preparation, are gratefully acknowledged.
References
1. Bakeev, K. A. (2005) Process Analytical Technology, Blackwell Publishing, Oxford, 451 p.
2. Pelletier, M.J. (1999) Analytical applications of Raman spectroscopy, Blackwell Publishing, Oxford, 488 p.
3. Schmitt, M. and Popp, J. (2006) Raman spectroscopy at the beginning of the twenty-first century. Journal of Raman Spectroscopy, volume 37, n° 1-3, p 20-28.
4. Smith, E. and Dent, G. (2005) Modern Raman Spectroscopy – A Practical Approach, Wiley Publishing, Hoboken, 210 p.
5. McGoverin, C.M., Rades, T. and Gordon, K.C. (2008) Recent pharmaceutical applications of Raman and Terahertz spectroscopies. Journal of pharmaceutical sciences, volume 97, n° 11, p. 4598-4621.
6. Heinz, A., Savolainen, M., Rades, T. and Strachan, C.J. (2007) Quantifying ternary mixtures of different solid-state forms of indomethacin by Raman and near-infrared spectroscopy. European Journal of Pharmaceutical Sciences, volume 32, n° 3, p.182-192.
7. Hausman, D.S., Cambron, R.T. and Sakr, A. (2005) Application of Raman spectroscopy for on-line monitoring of low dose blend uniformity, International journal of pharmaceutics. volume 298, n° 1, p. 80-90.
8. Svensson, O., Josefsol, M. and Langkilde, F.W. (1999) Reaction monitoring using Raman spectroscopy and chemometrics. Chemometrics and intelligent laboratory systems, volume 49, n° 1, p 49-66.
Dr. Nicolas Abatzoglou is full professor and Chairman of the Department of Chemical & Biotechnological Engineering of the Université de Sherbrooke. He is a specialist in Process Engineering involving particulate systems in reactive and nonreactive environments. He is the holder of the UdeS/Wyeth Industrial Research Chair on Process Analytical Technologies (PAT) in Pharmaceutical Engineering. He is co-founder of the company Enerkem Technologies Inc., a spin-off of the Université de Sherbrooke in the field of energy from renewable resources. He has a career of many years at both the academic and industrial levels. His professional experience as engineer spreads over the last twenty years. He represented Canada at the International Energy Agency (Gasification Task) from 1997-2001 and was the secretary of the Board of Directors and the Executive Committee of the AQME (Association québécoise pour la maîtrise de l’énergie) from 1996-2000. His production as a researcher includes a hundred of publications in scientific reviews, international conferences, plenary and invited lectures, patents and a book chapter.