Introduction
The production and sale of counterfeit pharmaceutical products is a global problem. The products can be brand-name or generic and range from expensive life saving medications to lifestyle drugs. Counterfeit pharmaceuticals pose a serious public health risk as they may contain little or no active ingredient, undeclared drugs, and/or harmful impurities. In some cases they have even been found to contain higher amounts of the active ingredients. The regular use of these products by unsuspecting consumers can lead to treatment failure, drug resistance, additional illness, or even death [1, 2].
It is estimated that counterfeit drug sales may have reached as high as $75 billion globally in 2010 [3]. Pharmaceutical drug counterfeiting is usually the greatest in regions where regulatory and legal oversight in the drug supply is the weakest. Unfortunately, the Internet has provided counterfeiters a convenient place to make their products available to everyone. It is estimated that over 50% of pharmaceutical products are counterfeit when purchased over the Internet from sites that conceal their physical address [1]. The increase in the counterfeiting of pharmaceuticals worldwide has become a major concern to the United States Food and Drug Administration (FDA). The number of investigations initiated by the agency has dramatically increased over the last decade [4].
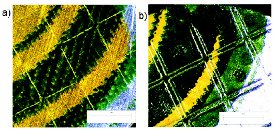
Figure 1 - Stereoscopic light micrographs of the a) suspect and b) authentic printing portion from Product 1.
Evidence obtained as part of these counterfeit investigations is analyzed by the FDA’s Forensic Chemistry Center (FCC). Suspect counterfeit product analysis at the FCC utilizes a wide range of analytical methods and instrumental techniques [5-7]; however, the analyses usually focus on the dosage form with limited analysis conducted on the packaging components. Currently, the analysis conducted on the packaging components consists of a visual examination of physical attributes (i.e., type of printing, colors). An example is illustrated in Figure 1, which shows visible differences in the side by side stereoscopic light micrographs of counterfeit and authentic package printing of the same product. Although visual examination is very effective at identifying counterfeit packaging, we wanted to expand our approach by developing a method for the chemical analysis of the packaging. FT-IR and Near-Infrared (NIR) historically have been used to ID and analyze polymer materials used in the manufacturing of pharmaceutical packaging [9-12]. Using FT-IR to obtain chemical information about the packaging provides added points of comparison when determining product authenticity. Furthermore, any trends observed in the chemical properties of the counterfeit packaging may be useful in identifying the source(s) of the counterfeit products.
Fourier Transform Infrared spectroscopy (FT-IR) and Scanning Electron Microscopy/ Energy Dispersive X-ray Spectroscopy (SEM/EDS) were used as complementary techniques in the packaging analysis. Components of a blister package from four different suspected counterfeit pharmaceutical products were analyzed and compared to the corresponding authentic packaging. The object of the work presented in this paper was to measure a series of authentic and counterfeit packaging components and to use this initial work as a basis for developing a method which could be used on future sample submissions in the laboratory.
Experimental
All authentic pharmaceutical products had been obtained directly from the manufacturer. Suspect counterfeit samples had been retained from adjudicated criminal cases. Prior to analysis, portions of each blister package were removed using a stainless steel cork borer (10 mm inner diameter).
Infrared measurements were acquired using a research-grade spectrometer equipped with an ATR accessory and a deuterated triglycine sulfate (DTGS) detector. Each packaging portion was analyzed using a load of 5. Spectral data was acquired with 64 co-additions from 4000 – 650 cm-1 at 4 cm-1 resolution.
SEM/EDS measurements were acquired using a commercial SEM system and energy dispersive spectrometry (EDS) hardware with a silicon drift detector. Each foil packaging portion was mounted with the printing side facing up on a 12 mm diameter circular piece of double-faced carbon conductive tape, which was then attached to a 25 mm diameter graphite planchet. The sample preparations were examined, uncoated, in the SEM using the backscattered electron (BSE) imaging mode under high vacuum at an accelerating voltage of 20 kV. EDS was used to acquire elemental spectra from field of view analyses and elemental maps of packaging comparison sites.
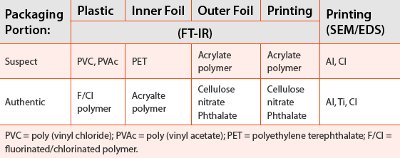
Table 1- FT-IR and SEM/EDS results for Product 1
Analysis of Counterfeit and Authentic Packaging using FT-IR and SEM-EDS
Four different areas on the blister packaging were analyzed using FT-IR: the plastic blister, the inner foil, and outer foil, and printing on the outer foil. Analysis by SEM-EDS was limited to the foil portions with printing. The FT-IR and SEM-EDS measurements were made in the same areas on both the suspect and authentic packaging so that a direct comparison could be made between the techniques. Figure 2 compares the FT-IR data of the suspect and authentic for each area analyzed on the blister package from Product 1. Each suspect packaging component spectrum exhibits significantly different spectral features than the corresponding authentic packaging component spectrum. Each spectrum (suspect and authentic) was searched against in house and commercial libraries to determine the major component(s) of the packaging portion. After the major components are determined, minor components can be determined by spectral subtractions and subsequent library searches. In Figure 2a, it was determined that the suspect outer foil consisted mainly of an acrylate polymer, while the authentic outer foil exhibited characteristics consistent with the presence of cellulose nitrate and a phthalate. The same process was then conducted on the other portions of the blister package for Product 1. In fact, all portions of the suspect Product 1 blister package were significantly differently than the authentic blister package. These results are summarized in Table 1.
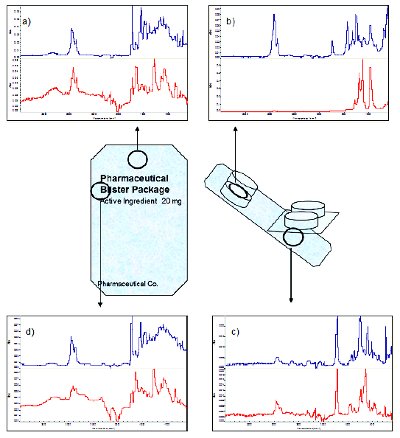
Figure 2 - FT-IR data for the suspect (blue) and authentic (red) packaging portions from Product 1: a) outer foil, b) plastic blister c) inner foil, and d) printing on the outer foil.
Interestingly, the FT-IR data of the suspect Product 1 outer foil and printing area (blue spectrum, Figures 2a and 2d) were found to be nearly identical. This was true for the authentic Product 1 outer foil and printing as well (red spectrum, Figures 2a and 2d). It is likely that contributions from the ink could not be measured because the laminate layer covering the foil was too thick. However, analysis of the printing area by SEM/EDS was not affected by the laminate layer and provided an elemental profile of the foil and printing ink. Figure 3 shows the EDS spectrum of the suspect Product 1 printing/foil (Figure 3a) compared to the EDS spectrum of the authentic Product 1 printing/foil (Figure 3b). The EDS spectra were collected from corresponding sites on the surface of each package over an area measuring ~ 8 mm2. In comparing the two spectra in Figure 3, titanium was abundantly present in the authentic, but not in the suspect. Moreover, the relative concentrations of chlorine and oxygen were also noticeably different. These results show that the elemental composition of the inks used for the printing on the suspect were not the same as that found on the authentic.
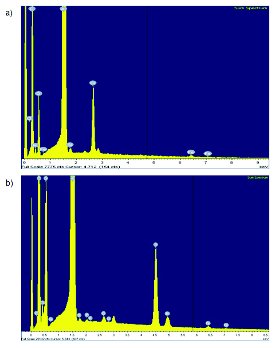
Figure 3 - EDS spectrum of the printing portion of Product 1: a) suspect product and b) authentic product.
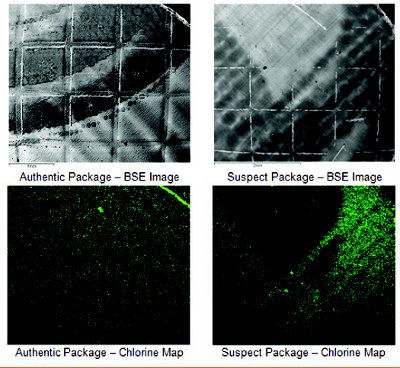
Figure 4 - Backscattered Electron Image (BSE) and elemental map of chlorine for printing packaging portion of Product 1.
Elemental maps for each element initially detected were then collected over the same areas. The elemental maps permit visual confirmation of the locations on the packaging containing each identified element. Furthermore, the intensity or “brightness” of the elemental maps provides some information of the relative concentration of that element in each area ranging from very bright (high concentration) to dark (low concentration to not present). Figure 4 shows the BSE images of closely associated package regions from the authentic and suspect Product 1, along with the corresponding elemental maps for chlorine. Although chlorine was identified in both the suspect and authentic packaging, the elemental maps for each portion show that it is not present in the same locations. For the authentic packaging, the chlorine is distributed over the entire area of the portion analyzed, where the chlorine in the suspect packaging is mainly concentrated in the printing areas.
Table 2 - FT-IR and SEM/EDS results for the suspect products 1-4.
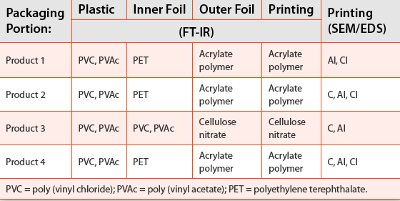
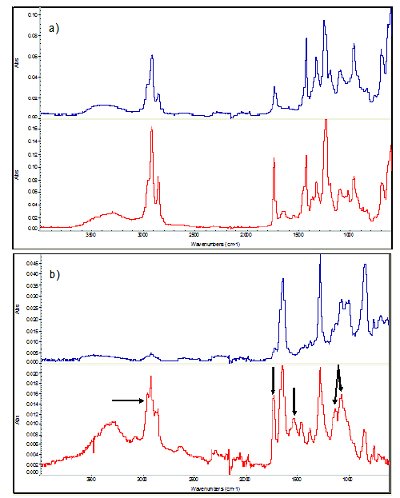
Figure 5 - a) FT-IR data of the suspect (blue) and authentic (red) plastic portion from Product 3. b) FT-IR data of the suspect (blue) and authentic (red) outer foil portion from Product 3; arrows used to highlight diff erences between the spectra.
The FT-IR and SEM/EDS analyses were completed on the suspect and authentic packaging for the other products in the same manner, and the results of the suspect packaging are summarized in Table 2. In a few instances, the major chemical component of the suspect packaging portion was the same as the corresponding authentic portion. For example, the suspect and authentic plastic portions from Product 3 were very similar and both consisted of a poly (vinyl chloride) / poly (vinyl acetate) co-polymer (Figure 5a). Conversely, the other packaging portions from suspect Product 3 were quite different than the corresponding authentic portion. Figure 5b shows the FT-IR data of the suspect outer foil portion compared to the authentic outer foil portion for Product 3. When searched against the in house and commercial libraries, both the suspect and authentic outer foil FT-IR spectra resulted in a match for cellulose nitrate. Despite having the same major chemical component, noticeable spectral differences were observed in the authentic outer foil and are highlighted with arrows in Figure 5b. These additional bands in the spectrum of the authentic portion correspond to the presence of a phthalate, which is not present in the suspect outer foil portion. In these few cases it can be shown that materials used by the counterfeiters can potentially be the same as those used by the legitimate manufacturers [13]. Therefore, it is important that chemical data from both FT-IR and SEM/EDS be collected in more than one location on the packaging. This allows for a more complete evaluation of the packaging and a more confident determination when trying to differentiate between and authentic and counterfeit product.
Another interesting trend was observed when comparing the FT-IR data collected of the suspect packaging. For suspect products 1, 2 and 4, the major and minor chemical components of each packaging portion were very similar to each other. In addition to determining product authenticity, the data collected of the suspect packaging components can be compared. Comparisons of the suspect packaging to each other may provide information on the commonalities of counterfeit packaging materials and may be helpful in determining a source(s) of the counterfeit products.
Conclusion
Chemical analysis of pharmaceutical packaging components is a unique approach to the screening for counterfeit pharmaceuticals. The chemical profile provided by FT-IR and the elemental profile and site identification provided by SEM/EDS contributes added points of comparison when determining product authenticity. When combining this information with physical analysis of the packaging (e.g. printing type) and chemical analysis of the product (e.g. tablet or capsule), a stronger conclusion can be made when declaring a suspect product “authentic” or “counterfeit”. Moreover, the chemical and/or elemental trends observed in the packaging components may be able to help in identifying the source of the counterfeit products.
References
- Medicines: Counterfeit medicines. World Heath Organization, January 2010. Web. 18 March 2011.
- Combating Counterfeit Drugs: A Report of the Food and Drug Administration. United States Food and Drug Administration, 18 February 2004. Web. 15 March 2011.
- Medicines: Counterfeit medicines. World Heath Organization, 14 November 2006. Web. 15 March 2011.
- Combating Counterfeit Drugs: A Report of the Food and Drug Administration Annual Update. United States Food and Drug Administration, 18 May 2005. Web. 14 March 2011
- Witkowski, M.R., Albright, D.; Batson, J.; Crowe, J.; Fulcher, M.; Lanzarotta, A; Andria, S.; Platek, S.F.; Ranieri, N. Trace Examination Techniques and their Use in Pharmaceutical Forensics presented at 36th annual FACSS meeting, Louisville, KY, October 2009; paper 220.
- Witkowski, M. R., The Use of Raman Spectroscopy in the Detection of Counterfeit and Adulterated Pharmaceutical Products. American Pharmaceutical Review 2005, 8 56-62.
- Lanzarotta, A., Baumann, L., Story, G. M., Witkowksi, M. R., Kahn, F., Sommers, A., Sommer, A., Rapid Molecular Imaging Using Attenuated Total Internal Refl ection Planar Array Infrared Spectroscopy for the Analysis of Counterfeit Pharmaceutical Tablets. Applied Spectroscopy 2009, 63, 979-991.
- Flurer, C. L., Wolnik, K. A., Chemical Profi ling of Pharmaceuticals by Capillary Electrophoresis in the Determination of Drug Origin. Journal of Chromatography, A 1994, 674, 153-163.
- Laasonen, M., Harmia-Pulkkinen, T., Simard, C., Rasanen, M., Vuorela, H., Determination of the Thickness of Plastic Sheets Used in Blister Packaging by Near Infrared Spectroscopy: Development and Validation of the Method. European Journal Pharmaceutical Sciences 2004, 21, 493-500.
- Koening, J. L., Spectroscopy of Polymers; American Chemical Society: Washington, DC, 1992.
- USP/NF. Rockville, MD: USPC<661>.
- USP/NF. Rockville, MD: USPC<1177>.
- Pilchik, R., Pharmaceutical Blister Packaging, Part 1: Rationale and Materials. Pharmaceutical Technology 2000, November, 68-77.
Author Biographies
Sara E. Andria is an Interdisciplinary Scientist, S. Frank Platek is an Interdisciplinary Scientist, Moseley Fulcher is an Interdisciplinary Scientist, and Mark R. Witkowski, is a Supervisory Interdisciplinary Scientist, all with the United States Food and Drug Administration, Forensic Chemistry Center’s Trace Examination Section, Cincinnati, Ohio.