Abstract
Amorphous solid dispersions are being used more frequently in the pharmaceutical industry to address bioavailability problems with poorly soluble drugs. Since amorphous dispersions are inherently metastable, there is always a possibility that the drug will convert to the more stable crystalline form, resulting in decreased bioavailability. One way to increase confidence that the material will not recrystallize is to ensure that the drug and polymer are miscible. In this article some important methods used to characterize drug-polymer miscibility are described and evaluated.
Introduction
Amorphous solid dispersions are being used with increasing frequency for poorly soluble pharmaceutical compounds in development. These systems consist of an amorphous active pharmaceutical ingredient (API) stabilized by a polymer [1]. Other dispersing agents, such as phospholipids and cyclodextrins, have also been used under the amorphous dispersion nomenclature, but these systems rely on different solubilizing mechanisms (micelle formation and complexation, respectively) and should be differentiated from the polymer-based systems. The most common types of systems are binary combinations, but more complex ternary and quaternary systems have also been produced. Surfactants are sometimes added to amorphous dispersion systems in an effort to increase apparent solubility or to aid in the melt extrusion process but can add complexity when manufacturing the dispersions process. Amorphous solid dispersions can be produced on a small scale using common laboratory techniques such as fast evaporation from solvent (rotary evaporator, freeze-drying, spray drying) and melt techniques. The most common large- scale production methods are spray-drying and melt extrusion.
Amorphous dispersions are commonly considered as a means of improving the apparent solubility of API. The amorphous form of the drug present in the dispersion will result in higher apparent solubility compared to that of the crystalline material [2]. This can result in improved dissolution and bioavailability for these materials. However, amorphous materials are also known to exhibit poor physical stability leading to crystallization, which negates any improvement in the other properties. The polymer in an amorphous solid dispersion is used to stabilize the amorphous drug so as to prevent crystallization and to provide physical stability over time and under a variety of stress conditions, such as elevated temperature and relative humidity (RH). In most cases, the API in solid amorphous dispersions is supersaturated with respect to the crystalline API leading to a potentially unstable system [3]. The goal, therefore, is to find an amorphous solid dispersion that can maintain kinetic stability over required timescales.
One important factor to consider when producing and choosing amorphous solid dispersions is miscibility, which is the ability to produce a homogeneous single phase where the components are intimately mixed at a molecular level. Physically separated mixtures of amorphous API and polymer are also commonly observed resulting in immiscible systems. Miscible amorphous solid dispersions will typically have a higher glass transition temperature (Tg) compared to the amorphous API due to the antiplasticizing effect of the polymer, resulting in lower molecular mobility and decreased crystallization [4]. The local environment of the API can also be altered in the dispersion by reducing the chemical potential of the API which will change the thermodynamic driving force for crystallization [5]. Favorable exothermic mixing will occur when interactions between the amorphous API and polymer are stronger and more abundant than interactions between the individual components [6]. These interactions include hydrogen bonding and dipole-dipole interactions, which can be investigated by a number of methods. Studies have shown that miscible amorphous solid dispersions show improved stability over immiscible systems for a number of compounds [7]. A variety of factors can affect miscibility such as concentration of API and polymer [8], stress conditions (temperature, relative humidity) [9], sample preparation [10], solvent composition [11], and analysis conditions [8]. Varying levels of miscibility may also be present in amorphous solid dispersion systems and this is a growing area of research as analytical techniques become more sophisticated.
A variety of techniques have been used to determine miscibility including differential scanning calorimetry (DSC) [12], x-ray powder diffraction (XRPD) with computational methods such as pair distribution functions (PDF) [13] or pure curve resolution method (PCRM) [8,14], solid-state NMR spectroscopy[15], infrared (IR) spectroscopy [8], thermally stimulated current (TSC) [16], atomic force microscopy (AFM) [17], and confocal Raman microscopy [18]. As with all characterization, it is important to use a multidisciplinary approach to understand miscibility in amorphous solid dispersion systems. This article will highlight three techniques (DSC, XRPD with computational methods, and solid-state NMR) to illustrate how different data can be used to determine the miscibility of amorphous solid dispersions.
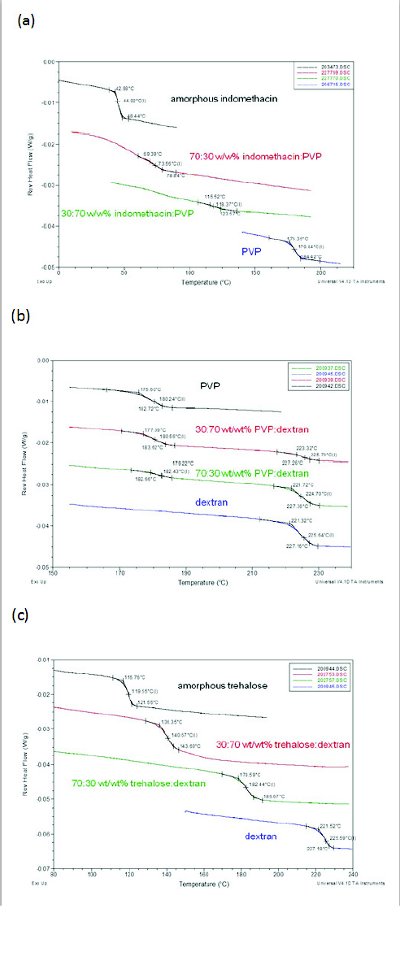
Figure 1. DSC curves of (a) miscible indomethacin:PVP, (b) immiscible PVP:dextran, and (c) nanaosuspension trehalose:dextran (adapted from Reference 13)
DSC has traditionally been used to determine if a system is miscible using the criteria that one Tg indicates miscibility and two Tgs indicate immiscibility. As shown in Figure 1a, indomethacin:PVP represents a miscible system at all concentrations; the Tg values for the dispersion are between the Tg values of the pure components and are predicted by the Fox equation [13]. An immiscible system is represented by PVP:dextran where two distinct Tgs are observed for various concentrations (Figure 1b). Concentration dependent miscibility is also possible, and an example is felodipine:PAA, where 10 and 30% polymer resulted in immiscible systems showing two Tgs, whereas samples containing 70 and 90% polymer showed one Tg indicating a miscible system [8].
Recently a number of reports have demonstrated the limitation of this technique by showing that one Tg can also be observed for phase-separated systems [8,10,13,15,18]. Reasons for this limitation include the inability of DSC to discriminate separated domain sizes below about 30 nm [21]and the dynamic nature of the DSC technique which could alter the miscibility during heating.
Table 1. Examples of Immiscible Systems Exhibiting One Glass Transition Temperature
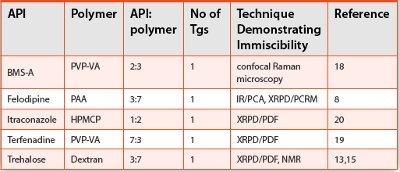
In the case of a 1:1 felodipine:PVP system, a heating regime of 20C/min up to 180C resulted in two Tgs and a heating regime of 20C/min up to 146C with a 30s isothermal hold resulted in one Tg [8].Examples of these phase separated systems are given in Table 1 and they have been called solid nanosuspensions or colloidal dispersions to represent the small domain sizes of the individual components. While the DSC method is a great tool to initially assess miscibility by looking for one Tg, other methods should be used to confi rm the miscibility of the sample.
XRPD with Computational Methods
The XRPD pattern of an amorphous material shows a lack of crystalline peaks and a broad background described as a halo. An amorphous material will exhibit up to three broad halos with the positions giving information on the short-range order in the sample. Changes in the sample, such as adding water to a polymer [22] or adding polymer to an API to produce a dispersion [13], will cause changes in the overall amorphous pattern. In some cases the changes may be additive compared to the individual components and in other cases a direct correlation to the individual components is not present. The powder pattern by itself will give limited information, but when combined with computational methods such as PDF [13] or PCRM [8,14], it will provide information not easily obtained by other methods.
PDF provides a fingerprint of the interatomic distances in the amorphous material and is presented as probability versus distance (Figure 2). The maxima represent commonly occurring interatomic distances and the product of the area under the maxima and the distance provides the number of atomic units with that specific separation. Miscibility can be determined by comparing PDF curves of the individual amorphous components to the dispersion data. If the dispersion curve cannot be described by the individual components, it indicates that the material is miscible with different interactions between the components. This is shown in Figure 2a for indomethacin:PVP where poor agreement is found between the individual components and the dispersion data indicating significant interactions between the components in a miscible system. If the dispersion curve can be described by the individual components, then the material is a physical mixture of the individual components. An example is given in Figure 2b for PVP:dextran where the concentration of each component calculated from the PDF analysis shows excellent correlation with the theoretical indicating that the material can be described by the individual components These types of computational methods are becoming more common in characterizing amorphous dispersion systems and determining miscibility [8,19,23]. Other analyses such as PCRM and Alternate Least Squares (ALS) have also been used to investigate the miscibility of this system [14].
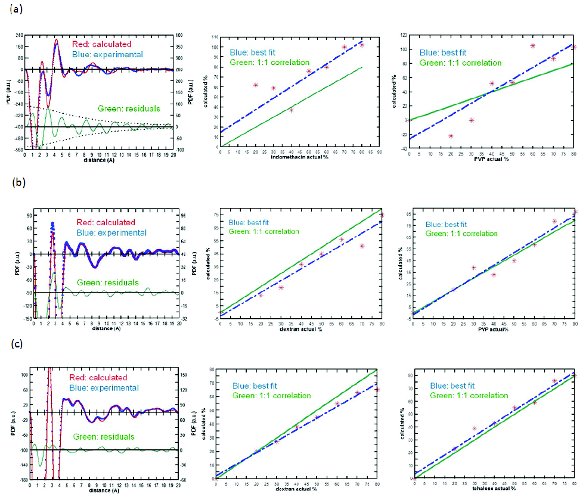
Figure 2. PDF (left) and correlation curve (right) of (a) miscible indomethacin:PVP, (b) immiscible PVP:dextran, and (c) nanaosuspension trehalose:dextran (adapted from reference 13)
Solid-State NMR
The 13C solid-state NMR spectrum of an amorphous material has broad peaks that are in approximately the same position compared to the solution spectrum. Amorphous peaks in the glassy state tend to be about 3-10 ppm broad, which is about an order of magnitude greater than the crystalline peak linewidths (Figure 3a). The peaks become significantly narrower above the glass transition temperature. The solid-state NMR spectrum of an amorphous material does not change significantly when the material is placed in a polymeric matrix. Because the amorphous peaks are much broader than crystalline peaks, however, it may be difficult to identify small amounts of amorphous material in the presence of crystalline material.
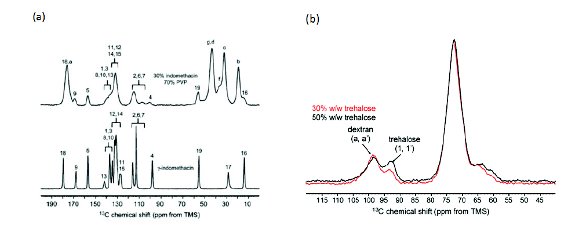
Figure 3. 13C SSNMR spectra of (a) 30:70 indomethacin:PVP dispersion (top) and crystalline γ-indomethacin (bottom), (b) 30:70 (red) and 50:50 (black) trehalose:dextran dispersion; characteristic peaks for dextran and trehalose are marked with arrows. (adapted from reference 15)
While the solid-state NMR spectrum is informative, the true power of solid-state NMR spectroscopy is the ability to study mobility, the application of multidimensional techniques (such as 2D NMR), and the ability to study multiple nuclei. NMR relaxation rates are governed by the mobility of the sample. T1 relaxation times reflect mobility at high frequencies, i.e. tens to hundreds of MHz, depending upon the magnetic field strength. T1ρ relaxation times correlate to mobility in the tens of KHz. For 13C NMR, the relaxation times reflect the local mobility at that particular carbon. For 1H NMR, the relaxation times in the solid state reflect the average mobility of the sample. T1 relaxation times are typically a few seconds for most amorphous materials. T1ρ relaxation times are typically tens of milliseconds in the glassy state, and start decreasing about 20° below the glass transition temperature. In amorphous dispersions, a single relaxation time for both the drug and polymer indicates that they are intimately mixed. A single 1H T1 relaxation time indicates that the drug and polymer are intimately mixed at domain sizes around 100 nm and greater. For example, studies with a 3:7 indomethacin:PVP dispersion resulted in average 1H T1 relaxation times of 5.9 + 0.3 s for indomethacin and 6.0 + 0.2 s for PVP, indicating a miscible dispersion [15]. A single 1H T1ρ time indicates intimate mixing at domain sizes of around 5 nm or greater. Multidimensional techniques, such as 1H – 13C heteronuclear correlation spectroscopy (HETCOR), can be used as well to determine if the drug and polymer are intimately mixed [15]. Finally, if the drug contains other nuclei such as 19F or 31P, the ability to detect small amounts of crystalline and/or amorphous forms can dramatically increase.
Case Study
Table 2. 13C Chemical Shifts (δ) and 13C-Detected 1H T1 values for Trehalose and Dextran Dispersions at two diff erent spin rates (νr) of 14 and 5 kHz (adapted from ref 15)
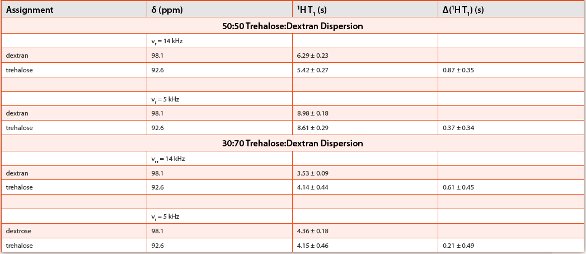
The ability of each of the techniques to study amorphous dispersions can be shown by considering the results of a study of an amorphous dispersion of trehalose and dextran [13,15]. Trehalose is a disaccharide that can interact through hydrogen bonding with dextran, a polysaccharide composed of many glucose units. Lyophilized formulations of various ratios of trehalose:dextran samples showed a common glass transition, suggesting that they are intimately mixed at the 10-30 nm range (Figure 1c). The corresponding XRPD PDF study indicated that the trehalose and dextran were phase separated (Figure 2c), suggesting that they form nanosuspensions that are not detected by DSC. Vogt and coworkers investigated 30% and 50% w/w trehalose-dextran mixtures using 13C solid-state NMR spectroscopy (Figure 3b). They also measured 1H T1 relaxation times as a function of spinning speed. Because magic-angle spinning averages dipolar couplings, it decreases the spin diffusion rate, allowing smaller domain sizes to be measured at higher spinning speeds. They found that for 50% trehalose-dextran formulations spinning at a rate of 5 kHz there was a common 1H.
T1 relaxation rate for both the trehalose and dextran (Table 2). At higher spinning speeds of 14 kHz, there were two distinct relaxation rates. They were able to estimate an upper limit to the domain size for the trehalose of < 82 nm, but were not able to establish a lower limit to the domain size because of difficulties in measuring the spin diffusion rate via the 1H T2 line width. Even though the DSC showed only one glass transition temperature, the trehalose:dextran dispersions were found to be phase separated by NMR and XRPD computational methods and were labeled as a nanosuspension based on the small domain sizes present in the dispersions.
Conclusions
The combination of DSC, XRPD, and solid-state NMR spectroscopy can provide a unique insight into the nature of pure amorphous material and amorphous dispersions. While DSC is an established technique for determining miscibility of amorphous dispersions, new developments in computational analysis for XRPD and the use of relaxation time measurements and 2D NMR approaches are providing even deeper insight into how miscibility can be characterized using these advanced analytical techniques.
References
- B. E. Padden, J. M. Miller, T. Robbins, P. D. Zocharski, L. Prasad, J. K. Spence, J. LaFountaine, “Amorphous Solid Dispersions as Enabling Formulation for Discovery and Early Development”, Amer.Pharm. Rev. 2011, Jan/Feb. 66-73.
- A. Newman, G. Knipp, G. Zografi. “Commentary: Assessing Performance of Amorphous Solid Dispersions”, J Pharm Sci 2012, 101, 1355-1377.
- J. Tao, Y. Sun, G. G. Z. Zhang, L. Yu, “Solubility of Small Molecule Crystals in Polymers: D-Mannitol in PVP, indomethacin in PVP/VA, and Nifedipine in PVP/VA”, Pharm Res, 2008, 26, 855-864.
- S. L. Shamblin, L. S. Taylor, G. Zografi, “Mixing Behavior of Colyophilized Binary Systems”, J Pharm Sci 1998, 87, 694-701.
- P. J. Marsac, S. L. Shamblin, L. S. Taylor, “Theoretical and Practical Approaches for Prediction of Drug-Polymer Miscibility and Solubility”, Pharm Res, 2010, 23, 2417-2426.
- S. L. Shamblin, L. S. Taylor, G. Zografi, “Mixing behavior of colyophilized binary amorphous systems”, J Pharm Sci, 1998, 87,694–701.
- I. Ivaniscevic, “Physical Stability Studies of Miscible Amorphous Solid Dispersions”, J Pharm Sci, 2010, 99, 4005-4012; S.-U. Yoo, S. L. Krill, Z. Wang, C. Telang, “Miscibility/Stability Considerations in Binary Dispersion Systems Composed of Functional Excipients towards the Design of Multi-Component Amorphous Systems”, J Pharm Sci, 2009, 98, 4711-4723
- A. C. F. Rumondor, I. Ivanesevic, S. Bates, D. E. Alonzo, L. S. Taylor, “Evaluation of Drug-Polymer Miscibility in Amorphous Solid Dispersion Systems”, Pharm Res, 2009, 26, 2523-2534
- P. J. Marsac, A. C. F. Rumondor, D. E. Nivens, U. S. Kestur, L. Stanciu, L. S. Taylor, “Effect of Temperature and Moisture on the Miscibility of Amorphous Dispersion of Felodipine and Poly(vinyl pyrrolidone)”, J Pharm Sci, 2010, 99, 169-185.
- B. Brettmann, E. Bell, A. Myerson, B. Trout, “Solid-State NMR Characterization of High-Loading Solid Solution of API and Excipients form by Electrospinning”, 2012, 101, 1538-1545; S. Qi and D. Q. M. Craig, “Detection of Phase Separation in Hot Melt Extruded Solid Dispersion Formulations”, Amer Pharm Rev, 2010, Sept/Oct, 68-74.
- A. Paudel, G. Van den Mooter, “Influence of Solvent Composition on the Miscibility and Physical Stability of Naproxen/PVP K 25 Solid Dispersions Prepared by Coclenvent Spray-Drying”, Pharm Res 2012, 29, 251-270.
- J. Albers, K. Matthee, K. Knoop, P. Kleinebudde, ‘Evaluation of Predictive Models for Stable Solid Solution Formation”, J Pharm Sci, 2011, 100, 667-680.
- A. Newman, D. Engers, S. Bates, I. Ivanisevic, R. C. Kelly, G. Zografi, “Characterization of Amorphous API:Polymer Mixtures Using X-Ray Powder Diffraction”, J Pharm. Sci. 2008, 97, 4840-4856.
- I. Ivanisevic, S. Bates, P. Chen, “Novel Methods for the Assessment of Miscibility of Amorphous Drug-Polymer Dispersions”, J Pharm Sci, 2009, 98, 3373-3386
- T. N. Pham, S. A. Watson, A. J. Edwards, M. Chavda, J. S. Clawson, M. Strohmeier, F. G. Vogt, “Analysis of Amorphous Solid Dispersions Using 2D Solid-State NMR and 1H T1 Relaxation Measurements”, Molec Pharm, 2010, 7, 1667-1691.
- R. A. Shmeis, Z. Wang, S. L. Krill, “A Mechanistic Investigation of an Amorphous Pharmaceutical and Its Solid Dispersions, Part I: A Comparative Analysis by Thermally Stimulated Depolarization Current and Differential Scanning Calorimetry”, Pharm Res 2004, 21, 2025-2030; R. A. Shmeis, Z. Wang, S. L. Krill, “A Mechanistic Investigation of an Amorphous Pharmaceutical and Its Solid Dispersions, Part II: Molecular Mobility and Activation Thermodynamic Parameters”, Pharm Res, 2004, 21, 2031-2039.
- M. E. Lauer, Ol Grassman, M. Siam, J. Tardio, L. Jacob, S. Page, J. H. Kindt, A. Engel, J. Alsenz, “Atomic Force Microscopy-Based Screening of Drug-Excipient Miscibility and Stability of Solid Dispersions”, Pharm Res, 2011, 28, 572-584.
- F. Qian, J. Huang, Q. Zhu, R, Haddadin, J. Gawal, R. Garmise, M. Hussain, “Is a Distinctive Single Tg a Reliable Indicator for the Homogeneity of Amorphous Solid Dispersion?”, Int J Pharm, 2010, 395, 232-235.
- M. D. Moore and P. L. D. Wildfong, “Informatics Calibration of a Molecular Descriptors Database to Predict Solid Dispersion Potential of Small Molecule Organic Solids”, Int J Pharm, 2011, 418, 217-226.
- D. Engers, J. Teng, J. Jimenez-Novoa, P. Gent, S. Hossack, C. Campbell, J. Thomson, I. Ivanisevic, A. Templeton, S. Byrn, A. Newman, “A Solid-State Approach to Enable Early Development Compounds: Selection and Animal Bioavailability Studies of an Itraconazle Amorphous Solid Dispersion:, J Pharm Sci, 2010, 99, 3901-3922.
- S. Krause,M. Iskander, “Phase separation instyrene-a-methyl styrene block copolymers”, In:Klempner D, Frisch KC, editors. Polymer scienceand technology. New York: Plenum Press. 1977, Vol. 10. pp 231–243; O. Olabisi, L. Robeson, M. Shaw. Polymer-polymer Miscibility.San Diego: Academic Press, Inc., 1979.
- P. Teng, S. Bates, D. A. Engers, K. Leach, P. Shields, Y. Yang, “Effect of Water Vapor Sorption on Local Structure of Poly(vinylpyrrolidone)”, J Pharm Sci, 2010, 99, 3815-3825.
- K. Nollenberger, A. Gryczke, Ch. Meier, J. Dressman, M. U. Schmidt, S. Bruhne, “Pair Distribution Function X-Ray Analysis Explains Dissolution Characteristics of Felodipine Melt Extrusion Products”, J Pharm Sci 2009, 98, 1476-1486.
Author Biographies
Dr. Ann Newman is a pharmaceutical consultant at Seventh Street Development Group. She received her Ph.D. in Chemistry from the University of Connecticut. Dr. Newman started her career at Bristol-Myers Squibb where she performed characterization studies on drug substances and products. As Vice President of Materials Science at SSCI, Inc. she was involved in characterization, form screening/ selection, quantitation, and problem solving for the pharmaceutical industry. As Vice President of Research and Development at Aptuit, she instituted a companywide R&D initiative covering API, preclinical, formulation, solids, analytical, clinical packaging, and regulatory. She holds an adjunct faculty position in Industrial and Physical Pharmacy at Purdue University and is author/collaborator on over 40 publications, 75 technical presentations, and 40 webinars.
Dr. Eric Munson received his B.A. degree from Augustana College in Sioux Falls, South Dakota. After studying one year in Munich, Germany, on a Fulbright Fellowship, he continued his education at Texas A&M University, where he received his Ph.D. degree in 1993. He then spent one year as a postdoctoral fellow at the University of California, Berkeley, under the direction of Professor Alexander Pines. In 1994 he started as an Assistant Professor in the Chemistry Department at the University of Minnesota, and was promoted to Associate Professor in 2000. In 2001 he moved to the Pharmaceutical Chemistry Department at the University of Kansas, where he was promoted to Professor in 2006. He then moved to the Pharmaceutical Sciences Department at the University of Kentucky in 2010 to become the Patrick DeLuca Professor in Pharmaceutical Technology. His research program is focused on the characterization of pharmaceutical solids using a variety of analytical techniques, with an emphasis on solid-state NMR spectroscopy. He is a recipient of an NSF CAREER award and a McKnight Land-Grant Professorship. » XRD » 98 |