Introduction
Over the last decades, production methods for drug nanocrystals have attracted a lot of interest, especially due to the increasing number of poorly soluble compounds in the drug development pipelines. The formulation of these compounds can help to overcome issues generally related with poor aqueous solubility of the active pharmaceutical ingredients (APIs). Typical issues of the compounds are: low oral bioavailability, food effects, incomplete or erratic absorption and a relatively high patient-to-patient variability. By reducing the size of the API to the nanometer range, the effective surface area is significantly increased which leads, consequently, to a faster dissolution rate. This relation is explained by the well-known Noyest-Whitney equation. Furthermore, very small drug nanocrystals show also an increased saturation solubility, which is explained by the Ostwald-Freundlich equation [1]. Distinctly increased dissolution rate can compensate the negative influence of the poorly soluble API to various extends, depending on whether the poor bioavailability is solely caused by the API’s low solubility. Oftentimes a direct relationship between the particle size and the achievable plasma concentrations can be found for compounds with a dissolution rate limited bioavailability [2]. Various publications also report reduced food effects for nanosized API [3-5]. In some cases, other factors, such as drug efflux transporters, first pass metabolism or degradation might also influence the drug absorption negatively.
Drug nanocrystals can be obtained by means of 1) precipitation starting from molecular API solutions (bottom-up), 2) comminution of larger particles down to nanoparticles (top-down), 3) combination of bottom-up and top-down principles (combination techniques) or 4) chemical reaction steps directly to nanoparticles (chemical reaction approach) [6]. Independently from the applied technique, it can be stated that the development of drug products containing nanosized APIs is a complex endeavor. Due to the diversity of scientific challenges, expert knowledge from different areas is needed in order to develop a stable, robust nano-product. This can be only achieved with a multidisciplinary team and a broad technological understanding by all players involved.
The small particle size range of the API is of course the most important difference in comparison with the development of standard formulations. It is an analytical challenge to accurately characterize the various nanostructures in intermediates and final drug products. Therefore, it is essential to understand the influence of the measurement equipment, the experimental conditions and the interplay between the factors. This review will give an overview of the existing characterization techniques that are required for the development of drug products containing nanosized API. It will focus on particle size measurement techniques and will explain special aspects of particle size analysis of nanosuspensions as well as nanosized API in final solid dosage forms.
Analytical Techniques for the Characterization of Nanoparticles
The development of nanosized products requires various analytical techniques. During the entire development sequence of an API, it is essential for the success of the program to control the critical quality attributes of the drug product. For a drug product containing nanosized API, it is obvious that the particle size as well as other physico-chemical properties of the API need to be carefully monitored at all stages. However, particle size analysis is only one aspect which should not be considered separately from others, such as solid state analysis or surface properties. The various production methods for drug nanocrystals can result in a modified solid state of the API in the final drug product. For instance precipitation methods (bottom-up) often result in amorphous API, which can be beneficial for a further improvement of the dissolution rate.
The higher rate of solubilization is not only influenced by the small particle size but also by a supersaturation effect of an API in an amorphous solid state. Only the combination of the results of different techniques will enable the developer to understand the system and to draw conclusions for factors as physical stability, etc. [7]. Therefore appropriate techniques have to be selected from a large variety of existing technologies. Typical techniques which are used for the characterization of drug nanocrystals are shown in Table 1.

Analytical Techniques for Particle Sizing of Drug Nanocrystals
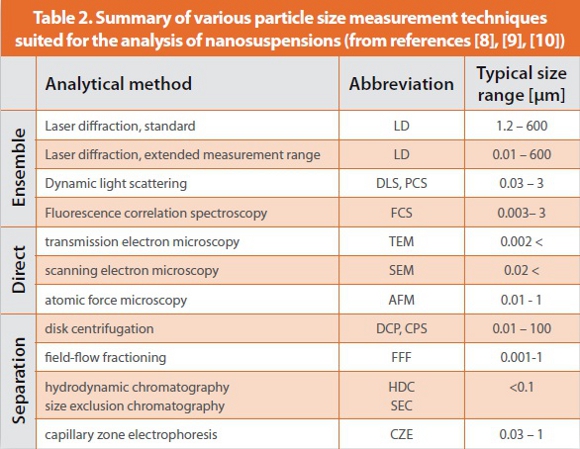
Particle size analysis is a key element in the pharmaceutical development, especially for products containing nanosized API. Once drug nanocrystals are obtained via the different production techniques, their particle size cannot be controlled anymore with macroscopic techniques. The formulator depends on the particle size measurements as well as on microscopic techniques to detect the result of his work on the nanosuspensions as well as on the individual drug nanocrystals. Small changes in the composition of the formulation or the process can significantly influence the particle size as well as the physical stability of the nanosuspensions. In order to better understand a complex system, such as nanosuspensions it is advised to combine the results of different techniques. Beyond that, the formulator should discuss the results and conclusions with the respective technical expert. A summary of important particle size analysis techniques is given in Table 2.
Aspects of Some Selected Techniques
Dynamic light scattering (DLS)
DLS, also known as photon correlation spectroscopy (PSC) uses time-depended intensity fluctuations of scattered laser light caused by Brownian movement of particles in the nanometer size range to derive via an autocorrelation function a diffusion coefficient of the particles. Via the Einstein-Stokes relationship the hydrodynamic particle diameter is calculated. DLS normally calculates also a polydispersity index (PDI) as a measure for the width of the particle size distribution. The smaller the PDI the more homogeneous the particles are distributed in the sample.
Laser Diffraction (LD)
LD is one of the most commonly used particle size measurement techniques in the pharmaceutical industry. The laser diffraction patterns of samples are measured using photomultipliers and from the signal intensity the particle size is calculated. One has to differentiate between equipment just analyzing the laser diffraction pattern of particles applying the Fraunhofer approximation and equipment which uses an extended measuring range in order to detect also submicron size particles accurately (using the Mie theory). Standard laser diffraction equipment can be used for particles in the size range from about 400 nm up to a few millimeters. For newer equipment, the size range is often extended down to the lower nanometer range by combining laser diffraction with other techniques, such as measurement of scattering intensities in different directions [11]. The extended measurement range makes modern LD equipment also useful for the analysis of nanoparticulate systems. Samples can be easily measured in suspension but also as aerosols or dry powders. This makes LD widely applicable for all measurement purposes.
Microscopic Methods (SEM, TEM)
Microscopic techniques are imaging techniques which directly determine the number average diameter of particles. Drug nanoparticles can be detected by electron microscopy when they have sufficient combination of size and electron density. The advantage of this technique is that it allows the formulators to visualize the result of their work. Another advantage is the direct nature of the results. The electron micrographs are showing the real particle size and particle morphology even of relatively small drug nanocrystals. Disadvantages of these techniques are the relatively labor intensive sample preparation as well as the low statistical validity, since only a very small fraction of the particles or samples can be analyzed in a reasonable time frame. Therefore, a good sampling procedure is crucial to get a representative result.
Application of Particle Size Analysis During the Development Programs
Control of the API Starting Material
The development of a drug product begins already with the quality control of the starting material. Oftentimes micronized API is used as starting material for top-down processes in order to avoid clogging of the equipment. Clogging can occur in high pressure homogenizers in the tiny homogenization gap, or in continuously operated ball mills at the media screen, which separates the milling media from the circulated suspension. Laser diffraction of API powders or API dispersed in a vehicle is the “gold standard”. It is often coupled with microscopic techniques to confirm the results. The objective is to test the consistency of the particle size of the starting material.
Aspects Regarding Nanosuspensions
In most cases, the API starting material is not directly converted into the final drug product containing the nanostructures. Usually nanosuspensions are. Therefore, the characterization of the suspension is an important aspect during development.
From a physical standpoint, nanosuspensions can be described as metastable systems. The system tends to reduce its interfacial surface tension by decreasing the effective surface area, either by forming larger agglomerates of particles, by dissolution of particles, or by Ostwald ripening. Ostwald ripening is a process in which small nanoparticles with higher saturation solubility dissolve. This dissolved fraction subsequently precipitates onto the surface of larger particles with lower saturation solubility. This eventually results in an increase in particle size of the suspension. Since this effect requires at least two particle size populations in one dispersed system it is more pronounced in nanosuspensions with a broad size distribution.
The nanosuspension characterization has several objectives: 1) control of the stabilization principle, 2) characterization of the particle size and particle size distribution, and 3) monitoring the physical stability of the nanosuspension and deriving predictions for its long term physical stability.
The selection of an appropriate stabilization principle for the specific particle size reduction method and the API is one of the key elements in the development process. In general one can distinguish four main stabilization principles: electrostatic stabilization using charged surfactants, steric stabilization using polymeric surfactants, electrosteric stabilization using a combination of the two systems mentioned before, and finally depletion stabilization by using long chain polymers [12].
Particle characterization techniques are used to control the effect of stabilization and to prove the success of a certain stabilization principle and the surfactant/stabilizer selection. Normally the formulator would use a combination of different analytical techniques, which are fast and accurate enough to be applied in a medium throughput setup. The combination of LD, PCS, optical microscopy and zeta potential measurements is used by many research groups as a standard for the initial characterization of nanosuspensions [13-16]. The PCS analysis yields a mean diameter (z-average) as a light intensity weighted size of the bulk population and the polydispersity index (PDI) as a measure for the width of the particle size distribution. LD measurements normally result in a volume based size distribution for the specific sample. Typical characterization parameters are the diameters d 50%, d 95%, and d 99%. The calculation of the particle size distribution from LD data should be done by applying the Mie theory, in order to interpret the contribution of the submicron particles correctly. The results of the particle size measurements can be supported with microscopic techniques, such as optical light microscopy. However, due to the limited resolution in the submicron range, optical microscopy is more used to control the effect of the stabilizer system on the aggregation tendency rather than to control the particle size of individual drug particles. More accurate imaging techniques such as electron microscopy (SEM or TEM) as well as AFM can be applied to confirm the results of the particle size measurements for some of the lead formulations. In general, these optical techniques are too time consuming to be used in a medium-throughput setup. Zeta potential measurements are useful and required to understand the system when electrostatic repulsion forces are used as stabilization principle, as it is the case when electrostatic stabilization or electrosteric stabilization are applied.
However, just the use of the equipment does not guarantee the validity of the obtained results. The problem is often a lack of understanding of the underlying theoretical principles. The equipment is used as a “black box” which generates a result, however not necessarily the right one. Recent studies regarding laser diffraction have shown, that equipment is often used incorrectly which can lead consequently to wrong conclusions. For the measurement of submicron particles, equipment with an extended measurement range is used which can apply the Mie theory. In this case, it is an important aspect to use the right optical parameters, i.e. real refractive index as well as imaginary refractive index, which has to be established for each nanosuspension with a certain composition. On the other hand, it can be beneficial to run the equipment without the extended measuring range using the Fraunhofer approximation for the correct detection of larger particles in the sample [11].
Another important aspect is the sample alteration during the measurement itself. LD as well as PCS measurements normally require the dilution of the nanosuspension in order to bring the scattering intensity into the appropriate range. This dilution can lead to a significant dissolution of a particle fraction of the sample resulting in incorrect results. In a study, it could be shown that measurements are more accurate when dilution is performed with medium which is saturated by using drug nanocrystals itself. This is also supporting the evidence that drug nanocrystals possess higher saturation solubilities than microparticles [17].
A suitable way to prevent a sample alteration during the measurements is the use of techniques which enable a measurement in the original suspension. One technique for this purpose is based on a multisample analytical centrifuge. The apparatus records space- and time-resolved extinction by measuring the intensity of transmitted light as function of time and position over the entire sample length in the original media without pre-dilution [18].
Nanosuspensions can be used as final drug product. In this case, it is necessary to produce stable nanosuspensions which provide sufficient chemical, physical, as well as, microbiological stability. Two products are currently on the market e.g. as oral suspension or as suspension for parenteral administration. This confirms that it is possible to develop a nanosuspension that is stable over the long term when one applies the right stabilization principles.
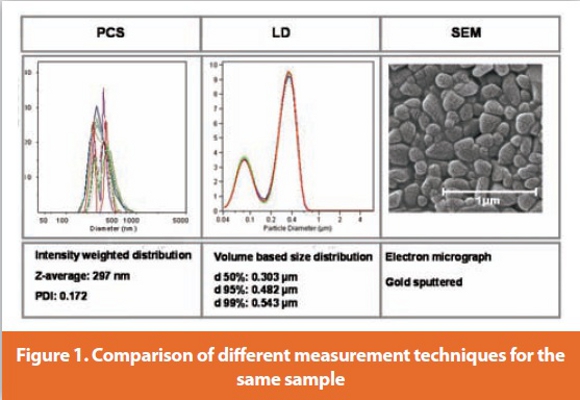
A typical result of a nanosuspension characterization using PCS, LD and SEM is shown in Figure 1. The API of this nanosuspension is crystalline and has no charged groups. The stabilization principle is based on electrosteric stabilization using a steric co-block-polymer as well as a negatively charged surfactant. The zeta potential for this nanosuspension was approximately – 30 mV in water with a conductivity adjusted to 50 μS/cm, indicating a sufficient stabilization. When measuring the particle size of the nanosuspension using photon correlation spectroscopy, the z-average was 297 nm and the polydispersity index was 0.172. This measurement was also used as basis for the LD measurements. As discussed above, one needs to take into consideration the correct optical parameters for a certain suspension, i.e. the real and imaginary refractive index. It requires significant effort in order to come very close to the real situation. A good approximation can be found by adjusting the optical parameters according to values reported in the literature [19]. Then the validity of the data can be confirmed by applying a third analytical method, in this case SEM. For this nanosuspension the RIimag to 0.01, reflecting the situation of white particles. Then the RIreal was varied until the results of the PCS measurements were matched. The optimal situation was found at a RIreal of 1.46. The results could be confirmed by SEM. Figure 1 right shows a relative homogeneously dispersed nanosuspension (PDI: 0.172) with a fraction of smaller particles and a fraction of slightly larger particles. This approximation is accurate enough for most situations. In situations where a higher accuracy is required one has to find the correct optical parameters experimentally [11]. PCS graph shows the intensity weighted distributions of ten measurements of the same sample (unit: nm), LD graph shows volume based size distribution of 3 individual measurements (unit: μm), modified after [20]
Aspects Regarding Drug Nanocrystals in Solid Dosage Forms
Oral solid dosage forms are the most preferred way to administer the API to the patient. This is also reflected by marketed products containing nanosized API – four out of six products are solid dosage forms. Therefore, it can be stated that nanosuspensions are often produced as intermediate but then transferred into the final solid dosage form by applying additional unit operations, such as drying procedures, blending and tabletting. The key aspect in this procedure is to ensure that the solid dosage form releases nanosized API at the side of action in order to obtain an improved dissolution rate of the poorly soluble API resulting in improved bioavailability.
During the development, several drying techniques to convert a nanosuspension into a dry powder are tested. The choice depends on the predicted production volumes, the available equipment for commercial scale production and of course also on cost of goods considerations. Typical examples for drying techniques are: spray-drying [21], freeze drying [22, 23], as well as spray-layering techniques [24] and wet granulation procedures [25]. In order to compare the influence of different drying methods on the particle size after reconstitution, the re-dispersibility of the powder of the nanosuspension in different media has to be tested. Various dispersion liquids, such as water or various buffer systems should be investigated, in order to reflect the situation the drug nanocrystals are exposed to in vivo situation. At this point, the interpretation of the results of the particle size measurements is very complex and requires a broad understanding of all factors influencing the results. Normally, the nanosuspension is not directly dried. In many cases, additional excipients are added prior to the drying. Insoluble filler material with a larger particle size than the drug nanoparticles, such as microcrystalline cellulose (MCC) can significantly influence the result of the particle size measurements. In this case it is difficult to interpret the results of LD measurements. One has to deal with at least two different particle size populations, small drug nanoparticles besides a fraction of larger particles resulting from the excipients used. However, depending on the LD equipment, it is also possible to analyze the particle size of the redispersed nanoparticles correctly. One way could be to evaluate the size distribution of the reconstituted sample with the distribution of a nanosuspension sample spiked with known amounts of excipients [26,27]. Another way is to apply different optical models, such as Fraunhofer and Mie, for the analysis of the same samples in order to detect nanoparticles and microparticles separately.
Conclusion
The development of robust drug products containing drug nanocrystals is a multiple step process which requires a lot of technical expertise. Particle size analysis is a key element. On the way towards the final drug product, the developer is faced with a large variety of different analytical techniques. The choice of the appropriate technique and the correct interpretation of the results can sometimes be scientifically challenging. However, it enables also the understanding of the overall manufacturing process of a nanomedicine as well as the underlying processes which are normally not directly accessible.
References
1. Junghanns, J.U. and R.H. Muller, Nanocrystal technology, drug delivery and clinical applications. Int J Nanomedicine, 2008. 3(3): p. 295-309.
2. Jinno, J., et al., Effect of particle size reduction on dissolution and oral absorption of a poorly water-soluble drug, cilostazol, in beagle dogs. J Control Release, 2006. 111(1-2): p. 56-64.
3. Rabinow, B.E., Nanosuspensions in drug delivery. Nat Rev Drug Discov, 2004. 3(9): p. 785-96.
4. Wu, Y., et al., The role of biopharmaceutics in the development of a clinical nanoparticle formulation of MK-0869: a Beagle dog model predicts improved bioavailability and diminished food effect on absorption in human. Int J Pharm, 2004. 285(1-2): p. 135-46.
5. Merisko-Liversidge, E., G.G. Liversidge, and E.R. Cooper, Nanosizing: a formulation approach for poorly-water-soluble compounds. Eur J Pharm Sci, 2003. 18(2): p. 113-20.
6. Möschwitzer, J., Particle Size Reduction Technologies in the Pharmaceutical Development Process. American Pharmaceutical Review, 2010(April): p. 54-59.
7. Domingos, R.F., et al., Characterizing manufactured nanoparticles in the environment: multimethod determination of particle sizes. Environ Sci Technol, 2009. 43(19): p. 7277-84.
8. Haskell, R.J., Characterization of submicron systems via optical methods. J Pharm Sci, 1998. 87(2): p. 125-9.
9. Giddings, J.C., Measuring colloidal and macromolecular properties by FFF. Anal Chem, 1995. 67(19): p. 592A-598A.
10. Radko, S.P. and A. Chrambach, Capillary electrophoresis of subcellular-sized particles. J Chromatogr B Biomed Sci Appl, 1999. 722(1-2): p. 1-10.
11. Keck, C.M. and R.H. Muller, Size analysis of submicron particles by laser diffractometry--90% of the published measurements are false. Int J Pharm, 2008. 355(1-2): p. 150-63.
12. Arndt, H., in Institut für Angewandte Makromolekulare Chemie 2002, Universität Stuttgart: Stuttgart.
13. Chingunpitak, J., et al., Formation, physical stability and in vitro antimalarial activity of dihydroartemisinin nanosuspensions obtained by co-grinding method. Drug Dev Ind Pharm, 2008. 34(3): p. 314-22.
14. Pu, X., et al., Development of a chemically stable 10-hydroxycamptothecin nanosuspensions. Int J Pharm, 2009. 379(1): p. 167-73.
15. Verma, S., et al., Quality by design approach to understand the process of nanosuspension preparation. Int J Pharm, 2009. 377(1-2): p. 185-98.
16. Xia, D., et al., Preparation of stable nitrendipine nanosuspensions using the precipitation ultrasonication method for enhancement of dissolution and oral bioavailability. Eur J Pharm Sci, 2010. 40(4): p. 325-34.
17. Keck, C.M., Particle size analysis of nanocrystals: improved analysis method. Int J Pharm, 2010. 390(1): p. 3-12.
18. Detloff, T., Sobisch, T., Lerche, D., Particle size distribution by space or time dependent extinction profiles obtained by analytical centrifugation (concentrated systems). Powder Technology, 2006(174): p. 50-55.
19. Müller, R.H., Schuhmann, R., Teilchengrößenmessung in der Laborpraxis. 1996: Wissenschaftliche Verlagsgesellschaft Stuttgart
20. Möschwitzer, J., Drug nanocrystals prepared by high-pressure homogenization - the universal formulation approach for poorly soluble drugs, in College of Pharmacy. 2005, Free University of Berlin. 21. Chaubal, M.V. and C. Popescu, Conversion of nanosuspensions into dry powders by spray drying: a case study. Pharm Res, 2008. 25(10): p. 2302-8.
22. Du, B., et al., Preparation and characterization of freeze-dried 2-methoxyestradiol nanoparticle powders. Pharmazie, 2010. 65(7): p. 471-6.
23. Lee, J. and Y. Cheng, Critical freezing rate in freeze drying nanocrystal dispersions. J Control Release, 2006. 111(1-2): p. 185-92.
24. Moschwitzer, J. and R.H. Muller, Spray coated pellets as carrier system for mucoadhesive drug nanocrystals. Eur J Pharm Biopharm, 2006. 62(3): p. 282-7.
25. Müller, R.H.M., J.; Bushrab, N. F., Manufacturing of nanoparticles by milling and homogenization techniques, in Nanoparticle Technology for Drug Delivery, G.a. Kompella, Editor. 2006, Marcel Dekker. p. 21-51.
26. Möschwitzer, J., Müller, R. H. Controlled drug delivery system for oral application of drug nanocrystals, T2119. in AAPS Annual Meeting. 2004. Baltimore.
27. Schmidt, C. and R. Bodmeier, Incorporation of polymeric nanoparticles into solid dosage forms. J Control Release, 1999. 57(2): p. 115-25.
Author Biography
Dr. Jan Möschwitzer is Head of Early Pharmaceutical Development at the Sector Product Development and Support of Abbott Healthcare Products B.V. (formerly Solvay Pharmaceuticals) in Weesp (The Netherlands). Jan has studied pharmacy at the Free University of Berlin, Germany. He has received a Ph.D. in Pharmaceutical Technology from the same University for a work in the area of drug nanocrystals. His main research activities are focused on the development of enabling formulations for poorly soluble and poorly permeable compounds.