Introduction
As a result of the Process analytical technology (PAT) initiative by FDA known as “Pharmaceutical cGMPs for the 21st century- A Risk Based Approach”, considerable work has been done on developing various analytical technologies that could be used as an integral part of PAT. Of all the efforts that have been put into practice to date, near infrared (NIR) spectroscopy is one of the most important tools that can be utilized in the product development process. The main advantage to this technology is that NIR spectroscopy can be employed at various stages of the process to achieve a more robust product through a more efficient process.
NIR spectroscopy is the only technology currently available that can be used in every step of the tablet manufacture process including raw material identification, blend homogeneity, tablet characterization, and end point determination in critical process parameters such as blending, granulation, and drying. In addition to its versatility, it is fairly easy to deploy and maintain in different manufacturing environments. Therefore, NIR spectroscopy is considered one of the most efficient and practical technologies all other PAT tools available today.
NIR spectroscopy is an efficient and non-destructive method for the detection and quantification of physical and chemical characteristics of tablets. It is possible to quantify many tablet attributes, such as drug content, hardness, and dissolution, non-destructively from a single measurement. Consequently, numerous research articles have been published on the various applications of NIR spectroscopy in tablet manufacture that it has become an industry standard PAT tool. However, there is no standard protocol (unlike HPLC method development) for developing calibration models and deploying the instruments in the manufacturing setting. Each method development requires special sample and variable selection techniques as well as calibration model building tools dependent on the number and nature of the samples and the analyte of interest. Recently, there have been significant advances in the instrument design, sample selection, and modeling techniques resulting in improved data quality and user confidence. This review will provide some of the basics of NIR spectroscopy and its applications in tablet manufacture.
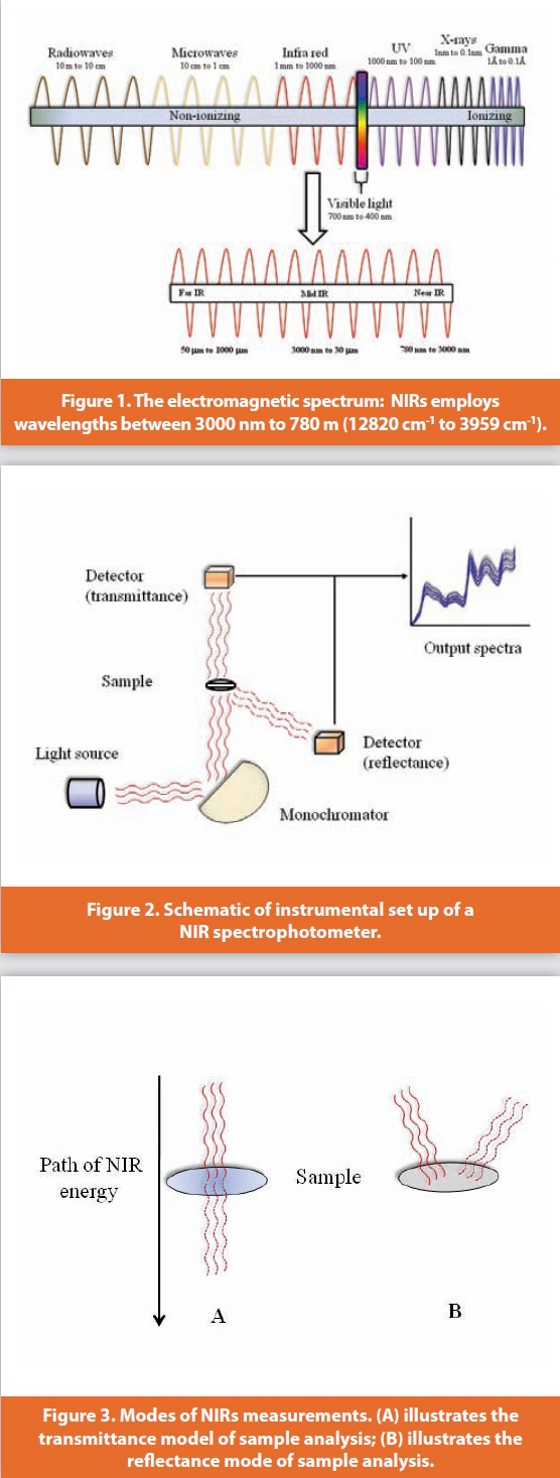
According to the American Society of Testing and Materials (ASTM), the NIR region is defined as a spectrum of electromagnetic radiation ranging from 780 nm to 2526 nm (3959 cm-1 to 12820 cm-1) (figure 1). Absorption of light in the NIR region is primarily due to overtones or combinations of fundamental vibration bands occurring in the mid- IR (MIR) (400 to4000 cm-1 or 2.5 to30 μm) region. NIR spectroscopy can be utilized to identify and characterize physical attributes of the analyte. This is due to the fact that every chemical entity exhibits a fundamental vibrational frequency, which is specific to its chemical structure or constitution. In order for these substances to absorb infrared light, the energy of the incident light has to be high enough to produce vibrational transitions at a molecular level. Specifically, the incident light energy should match the fundamental vibrational frequency of the molecule such that its dipole moment is altered resulting in absorption of the incident energy. The most common absorption bands are related to combinations or overtones of fundamental vibrational frequencies of functional groups such as –CH-, hydroxyl (-OH), amide (-NH), and thiol (-SH)[1].
The vibrational frequency (f ) of a diatomic molecule can be defined by the Hooke’s law:
f = 1/2πc ∙ √k/m
Where “c” is the speed of light, “k” is the bonding force constant, and “m” is the reduced mass. However this equation holds true for harmonic oscillations and not for polyatomic molecules. In order to account for the anharmonity, additional higher order terms are employed as correction factors resulting in a new equation that helps define the harmonics or overtones appearing at higher frequencies. In polyatomic systems, numerous fundamental frequencies exist and can exhibit simultaneous changes in the energies of the more than two vibrational modes resulting in observed frequencies that are either sums or differences of the individual fundamental frequencies. For NIR spectroscopy, most of the observed bonds are overtones or combinations of hydrogen bonds characterized by the small mass of hydrogen and large force constants. Functional groups without hydrogen, such as carbonyl (C=O) and methylene (C-C), usually exhibit weak bands in the NIR region.
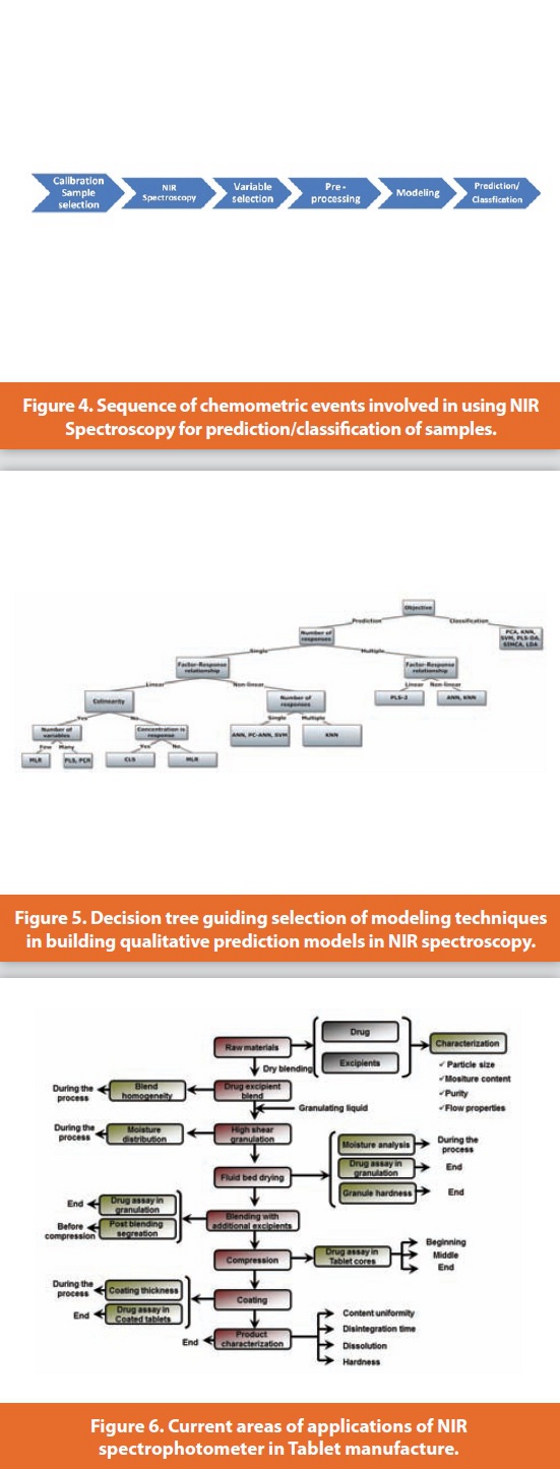
NIR spectrophotometers are typically comprised of a light source, a monochromator, a sample holder or a sampling interface, and a detector (figure 2). A more complete review of NIR instrumentations has been discussed in published reviews and will not be discussed here. The instrument must have high signal to noise ratio, instrumental stability, adequate resolution of the spectra, and optimal sampling peripherals to be efficient.
The most common modes of NIR spectropscopy measurements used in pharmaceutical applications are transmittance, reflectance, and diffuse reflectance (figure 3). These modes are dictated by the sample properties and are non-destructive. NIR analyzers also provide real-time information of process parameters by in-line and on-line analysis. Since these readings are obtained in either the transmittance or reflectance modes, in process data is obtained by non-contact reflectance measurements.
Unlike UV spectroscopy, NIR spectroscopy yields multivariate spectrum. NIR spectrum has information about both physical (e.g. tablet hardness, coating thickness, etc.) and chemical nature (e.g. drug content, polymorphic form) of the samples. Thus, special processing techniques are required to extract the information out of the spectrum and relate to the property of interest (physical/chemical). The techniques used for information extraction and model building from NIR spectrum are referred to as Chemometrics.
Chemometrics
Chemometrics is the science of using mathematical and statistical tools for extracting information from multivariate spectra and building models using the extracted information for prediction and classification purposes. Figure 4 shows the sequence of events when using NIR spectroscopy for prediction or classification. Like any other spectroscopic techniques, NIR requires calibration samples to build models that can later be used to identify or predicted properties of new samples. Few basic principles must be followed in selecting calibration samples;
1. All types of combinations of samples must be represented in the calibration standards.
2. Variations in the calibration samples must be as wide as possible; i.e. there must be enough variance in the sample that would facilitate model building.
3. Calibration samples must be spread as evenly as possible.
In order to obtain adequately distributed samples from poorly distributed samples, one of the following techniques could be used;
1. Distance based selection
2. D-Optimal method
If there is large number of calibration samples available, then statistical tools can be used to select samples for building calibration models. One such technique is cluster analysis. Cluster analysis is used to identify sample clusters with similar characteristics. Once isolated as clusters, one representative sample from each cluster could be used when building calibration models. Principal component analysis (PCA) must be performed before cluster analysis if there is co-linearity among samples. Thus, if there is co-linearity among samples, then cluster analysis is performed using scores from PCA.
In UV spectroscopy, λ max of a molecule is its signature property and absorbance differences at λ max are related to differences in the concentration of the molecule. However, in NIR spectroscopy, due to vibration of molecular bonds that yield the spectrum, the chemical signature of the molecule is masked by many confounding factors. Thus it is important to identify which of the variables in the spectrum has a statistically significant relationship with the property of interest. Methods used for variable selection can be grouped into two categories
1. Univariate relationship method
2. Multivariate methods
In univariate relationship method, series of linear regressions are performed using absorbance differences at each wavelength in the spectra and property of interest. Slope of this linear regression and the residual error of the models are used to create signal-to-noise ratio (SNR) for each linear regression model and then used to select variables that have best SNR. Multivariate methods used for variable selection are more sophisticated and computationally intensive compared to univariate relationship methods. One of the commonly used multivariate technique is PCA where variance in the spectra is extracted into a few principal components, which are late used for model building. Other commonly used methods of variable selection include iPLS and genetic algorithm. Stepwise selection and retention of groups of sequential variables is carried out in iPLS. In genetic algorithm, variables are selected by a process that mimics evolution i.e. a group of variables is randomly selected and allowed to mate with each other. Their fitness is evaluated by their predictability. Variables with the best predictability are retained and others are removed from the generation. This process is repeated until the best combination of variables that yield predictability is identified.
Pre-processing of the NIR spectra provides many advantages by making the spectra more specific to the analyte of interest. A wide array of techniques are available for spectral preprocessing and the selection is based on the objective and the nature of the spectrum. Broadly, the objectives of spectral pre-processing could be either one or many of the following: offset the baseline, filter the information, compress the data, and select samples. Baseline corrections can be done using mean centering and removing the absolute intensities from each variable. This enables modeling methods to focus on variations about the mean. Filtering is done generally using derivatives, smoothing functions, or extended multiple scatter corrections (EMSC). Derivatives remove baseline offset variations between samples and provide a stable baseline for comparing samples and improve resolution of overlapped spectral features by providing better separation. Savitsky-Golay algorithm is commonly used in NIR spectral pre-processing. It combines both derivative and smoothing functions and consists of three parameters, namely window width, derivative order, and polynomial order. Window width determines the amount of smoothing that accompanies the spectra. Derivative order will determine the kind of pre-processing to be used; i.e. zero order derivative will result only in smoothing, first order derivative will remove baseline offset variations, and second order derivative gives both baseline offset and removes differences in the baseline slopes. EMSC filters data using two set of parameters. The first set of parameters are derived using linear regression similarly to multiplicative scatter correction (MSC). The second set of parameters contain information that was not captured by the linear regression parameters. Therefore EMSC is very useful in removing spectral effects that are suspected to be irrelevant to the problem. MSC and standard normal variate (SNV) are the most commonly used sample wise scaling techniques. During MSC preprocessing, a reference spectrum (commonly reference spectrum is mean spectrum) is identified and the MSC spectrum calculated via linear regression of the reference spectrum. The sample spectrums are assumed to be multiples of the reference spectrum. SNV is used to correct multiplicative variations between spectra. Multiplicative variations are the result of uncontrolled/unintended differences in the sample path and variations in the physical properties of samples. These spectral defects can neither be removed by derivatives nor by mean centering but need to be corrected.
Selection of the appropriate techniques for building calibration models is dependent on many factors such as the objective (prediction/classification), response of interest (concentration/nonconcentration), factor response relationship (linear/nonlinear), colinearity, and type of spectral interference/additive effects. Each of the modeling techniques requires selection of the correct sample set, the correct combination of variables and training parameters. Although it is out-of-the scope of this article to explain each of these modeling techniques, a decision tree (figure 5) can be used for selection of the right modeling technique.
Use of NIR Spectroscopy in the Tabletting Process
Raw Material Characterization
NIR spectroscopy is used by various excipient manufacturers for raw material characterization. NIR spectroscopy can be a valuable tool for characterizing physical, chemical, and optical characteristics of both API and excipients. Although NIR spectroscopy cannot be the primary analytical method for characterizing raw materials, its sensitivity to certain raw materials characteristics (e.g. moisture content) and speed of analysis make it a useful tool. NIR spectroscopy cannot detect or quantify low quantities of moisture in raw materials but it can differentiate raw materials based on the status (bound/unbound) of the water molecule [2]. In spite of their chemical similarity, bound and unbound water in the sample differ in the width of the peak observed so that the status of the water in the samples can be identified. For example, the water band (1940 nm) in a lactose sample containing water of crystallization is narrow, while the water band for MCC or starch containing free moisture is broad although it appears in the same position [3]. This can be explained by the relatively uniform solid-water interactions in lactose monohydrate compared to starch or MCC where the energies are more diffuse in nature. Thus, by separating the water of crystallization from the free water fraction, NIR spectroscopy provides an advantage over other more conventional techniques such as Karl Fisher titration.
Blend Homogeneity
Most APIs do not have the appropriate properties required to formulate them into solid dosage forms. Poor flow and compaction issues can result in non-uniformity of the drug content and tablet weight variation, respectively. These problems are often addressed by selecting the appropriate excipients, ensuring adequate blending of API and excipients, and, in some cases, additional processing to convert the API-excipient blend into granules. Most commonly used excipients can be categorized into binders, disintegrants, and fillers. In order to optimize dosage form characteristics, one or more excipients from each category are selected and the composition is determined. For processes involving both direct compression and wet granulation prior to compression, a determination of blend homogeneity is required. Such evaluations provide useful information to the formulator when troubleshooting content uniformity issues. NIR spectroscopy serves as an important non-destructive analytical tool for in-line determination of blend homogeneity by eliminating the issues, such as flow disturbances, caused by sample thieves used in traditional content uniformity testing of powder blends. The NIR spectrophotometer probe can be assembled along the rotational axis of a V-blender for in-line measurements. The spectral information is then obtained for various ingredients in the blend and the spectras are overlaid after appropriate mathematical pre-treatments (e.g. derivatization). The normal expectation is that spectras are significantly different at the beginning of the blending process (due to stratification of individual components) and the spectral variability reduces as the blend approaches homogeneity [4].
Granulation
Granulation is a crucial process for APIs that exhibit poor flow and compaction properties. Converting such APIs into relatively larger and spherical granules not only provides the necessary flow characteristics but also results in superior compaction and content uniformity of the final tablets. Granulation can be achieved by either a low shear or a high shear mode depending on the f nal product requirements. Irrespective of the technique used for granulation, end point determination is very critical because over/under granulated product will not provide the advantages of granulation process. NIR spectroscopy has found both in-line and off -line applications for end point determination of granulations both in low shear and high shear processes. Calibration models have been developed not only for the more commonly employed moisture determination but also for the particle size distribution and bulk density of the granules. The most commonly used bands in NIR spectroscopy for moisture determination are the ones at 1940 nm [corresponding to the combination of water (-OH) stretching and bending vibrations] and at 1450 nm [corresponding to the first overtone of the –OH stretching vibration].

The granulation process stages including initial premixing, binder addition, and drying of granules (in fluid bed granulation) result in certain changes in the NIR spectra of the constituents of the blend. For example, the intensity of the water band at 1940 nm increases with the addition of a binding liquid, and the overall baseline shifts to higher absorbance values upon increase in the granule size. Such spectral changes can be converted to the principal component scores to develop a comparative understanding of the different stages of the granulation process. The usual trend for the moisture levels in a fluid bed granulation process as monitored by a NIR spectrophotometer are as follows; an initial increase is observed in the moisture content of the blend reaching a peak value, followed by a decrease in the moisture levels upon initiation of the drying stage and finally reaches equilibrium moisture levels. Similarly, granule size follows the trend of an initial increase in size, followed by a decrease during the drying phase, and finally attaining a plateau.
NIR also helps to evaluate the effects of one binder compared to another binder on granule properties due to differences in the spectral changes caused by these individual binding agents. For example, PVP causes a marked difference in the spectral characteristics in the regions around 1700 and 2200 nm compared to water as the binder for glass balloting. Additionally, the increase in the intensity of the moisture bands is different among different binders. For example, MCC causes a relatively smaller increase in the intensity of moisture band at 1940 nm compared to glass beads because MCC absorbs water in its fibers due to its organic nature, while glass beads adsorb it as a result of its inorganic nature [5]. Such differences in the state of water i.e. adsorbed or absorbed cause changes in the refractive index of the material, which is then responsible for the observed spectral differences in these materials.
Drying
Drying is a critical step to be monitored during the tablet manufacturing process. It is extremely important for the granules to have some residual moisture that will enable adequate bonding between the granules to form tablets of sufficient strength. The complete absence of moisture from the granules would result in a lack of hydrogen bonding which is one of the primary mechanisms of binding during granule compaction.
Most of the conventional techniques used for moisture determination such as Karl Fisher and LOD require sampling of the granules during the drying process. This could lead to issues including re-uptake of moisture by the sample withdrawn for analysis as well as safety and hygiene issues. The importance of NIR spectroscopy is increasing as the tool used for monitoring the drying process of granules made by high shear granulator as well as those made by low shear in a fluid bed granulator. Calibration models have been developed by comparing the NIR algorithm with off-line analytical measurements of moisture levels and particle size [6]. Since granular particle size decreases during the drying process due to collisional forces, it is important to measure both the moisture level and granule size. Apart from determining the end point for drying of granulation using moisture content determination during the process, NIR can also be used for drug content and hardness determination of the dried granules at the end of drying stage.
Compression and Product Characterization
The granules are finally compressed into tablets after drying and blending with additional excipients such as glidants and lubricants. Not much progress has been made so far in terms of developing an in-line NIR spectroscopy method for the tablet characterization for evaluating critical properties such as tablet hardness or thickness. These properties and other product attributes such as tablet disintegration and dissolution can however, be evaluated by using off-line NIR spectroscopy methods. Tablet attributes such as hardness and disintegration can be predicted by building appropriate off-line NIR spectroscopy models that correlate the NIR spectral response with the product properties measured by using other analytical techniques. These may include a tablet hardness tester and the USP disintegration test assembly. Tablets with different hardness values usually result in a shift in the spectral baseline especially at larger wavelengths. Since the actual chemistry of the sample changes very little with varying hardness, there is usually not much difference observed in the shape and position of the peaks and valleys in the NIR spectra. The baseline, however changes due to different scattering effects at various hardness levels. Apart from the shift in spectral baseline, the intensity of water bands also change in some samples indicating a change in the solid-water interaction in the tablet product after compression. The higher signal intensity of the moisture band at relatively higher hardness values is also due to densification of the tablet contents and larger signal detection by IR. Additionally, an increase in hydrogen bonding in the compact might result in a bathochromic shift of the water band as well.
The atypical advantage of NIR spectroscopy for hardness testing over other more conventional hardness testers is its non-destructive nature. However, dissolution of tablets has also been studied using NIR spectroscopy. Robust models have been created for certain drug substances using the spectral characteristic of the API in order to correlate with the real time percent drug release values [7].
Tablet Coating
NIR spectroscopy is also used as an in-line technique to measure coating thickness and locate any coating defects. Several techniques have been used in the past and continue to be used to date for analyzing the tablet coatings. These include light microscopy, atomic force microscopy, and confocal laser scanning microscopy. Although most of these techniques successfully provide information on coating thickness and other defects, most of them are destructive and/or cannot be used in-line for the PAT applications.
The underlying principle of coating thickness determination by NIR spectroscopy is based on Beer-Lambert’s law which states that the absorbance is directly proportional to the ratio of incident light to the transmitted light. The ratio of transmitted light to incident light decreases as a direct effect of the increase in coating thickness, thus resulting in intensity changes in the baseline signal. This is used in determination of coating thickness. The NIR signals from the tablet core and the coating material can be used in the process. Calibration models have been created using the decrease in signal from the tablet core and the increase in signal from the coating material. For example, Maurer et.al used the signal at 2120 nm from the core and 1390 nm from the coating in order to build calibration models for measuring coating thickness.
NIR imaging also helps identify coating defects such as capping, lamination, chipping of the coating layer, scratches etc. Another new technique is Terahertz pulse imaging (TPI) which is based on the far infrared region and mostly utilizes the refractive index information of the material. Therefore, if the refractive index of the coating materials is known, there is no need to build calibration models using NIR spectroscopy. However, NIR spectroscopy does offer an advantage over the relatively new TPI method due to its higher spatial resolution. NIR spectroscopy can provide more precise information for the challenging regions in the tablet such as tablet edges, embossing etc.
Conclusions
In the pharmaceutical industry, there has been significant progress in the last decade in adopting NIR spectroscopy as a prime PAT tool. This is depicted by the efforts made to improve its design and usability in numerous applications. Unlike any other effort in this area, there has been constant collaboration among academics, industries, and regulatory agencies across the world. Although there exists a consensus identifying the value of NIR spectroscopy, there is still much work to be done before scientists and regulatory agencies will accept it as real-time drug product release tool.
Acknowledgements
Heather Persson, PhD & Dennis Nelson, PhD of Merck Consumer Care
References
1. Reich, G., Near-infrared spectroscopy and imaging: basic principles and pharmaceutical applications.Adv Drug Deliv Rev, 2005. 57(8): p. 1109-43.
2. Airaksinen, S., et al., Effects of excipients on hydrate formation in wet masses containing theophylline. J Pharm Sci, 2003. 92(3): p. 516-28.
3. Rantanen, J., et al., Process analysis of fluidized bed granulation.AAPS PharmSciTech, 2001.2(4): p. 21.
4. Sekulic, S.W., HW; Brannegan,DR; Stanley, ED; Evans, CL; Sciavolino,ST; Hailey, PA; Aldridge, PK, On-Line Monitoring of Powder Blend Homogeneity by Near-Infrared Spectroscopy. Analytical Chemistry, 1996. 68: p. 509- 513.
5. Rantanen, J., et al., In-line moisture measurement during granulation with a four-wavelength near infrared sensor: an evaluation of particle size and binder effects.Eur J Pharm Biopharm, 2000. 50(2): p. 271-6.
6. Findlay, W.P., G.R. Peck, and K.R. Morris, Determination of fluidized bed granulation end point using near-infrared spectroscopy and phenomenological analysis. J Pharm Sci, 2005. 94(3): p. 604-12.
7. Freitas, M.P., et al., Prediction of drug dissolution profiles from tablets using NIR diffuse reflectance spectroscopy: a rapid and nondestructive method.J Pharm Biomed Anal, 2005.39(1-2): p. 17-21.
Author Biographies
Dr. M. Gerald Rajan is a Senior Scientist at Merck Consumer Care. His major interests are in non- destructive testing of solid oral dosage forms, statistical modeling, product and process development and biopharmaceutics of various dosage forms.. He has a doctoral degree from the University of Tennessee, Health Science Center.
Dr. Joe Reo has over 31 years of experience developing prescription and over-the-counter (OTC) drug products. He is currently a Research Fellow at Merck Consumer Care (formerly Schering- Plough Healthcare). In this role, he oversees a formulation group and is the program technical lead for several OTC NDA-based products, with combined projected revenue of over 200 Million. Prior to joining Merck, Joe worked in the pharmaceutical development group at Pfizer developing prescription drug products, McNeil Consumer Healthcare where he developed OTC drug products and Berlex Laboratories where he developed prescription drug products. Joe is the Formulation Design and Development section representative to the Content Advisory Committee of the American Association of Pharmaceutical Scientists (AAPS) and is the Past-Chair of the AAPS Modified Release Focus Group. His current areas of interest are in understanding factors that influence drug absorption and streamlining the development processes to get products to market faster, under riskbased decision-making paradigms.
Sonia Bedi is a Ph.D. Candidate at University of Tennessee Health Science Center currently working on biodegradable polymer injectable drug delivery systems. Her research interest include preformulation (solid state characterization, solubility studies), and formulation of solid oral dosage forms (including conventional and modified release dosage forms). Additionally,, she has experience working in the intellectual property department in industry.
Dr. Himanshu Bhattacharjee is appointed as a faculty in the University of Tennessee Health Science Center, College of Pharmacy. He also holds the position of Associate Director of Research at the Plough Center for Sterile Drug Delivery. With a background in drug discovery, Dr. Bhattacharjee is involved in conducting pre-formulation and formulation development studies to design novel delivery systems. He is actively involved in research, design and development of solid as well as parenteral drug delivery systems. His current research efforts are to develop clinically relevant, efficacious and safe drug delivery systems for the treatment of high mortality diseases like pancreatic, ovarian, lung, and brain cancers. He additionally has extensive experience in aspects of quality control and sterility testing of parenteral dosage forms and instructs academic as well as industry professionals.