Introduction
In recent years, vibrational spectroscopic instruments such as Raman and Near Infrared (NIR) in conjunction with multivariate calibration routines have become increasingly important process analyzers in the pharmaceutical industry [1-24]. These analyzers offer several advantages over conventional wet chemistry techniques, which include non-invasiveness, little or no sample preparation and rapid measurements. Raman and NIR sensors can provide critical quality information during different stages of the active pharmaceutical ingredient (API) and drug product manufacturing, and are commonly employed during raw material dispensing, chemical reactions (mostly Raman), granulations, drying (mostly NIR) and powder blending. They can also be used as non-destructive quality verification techniques, particularly for polymorph detection/quantification, blend potency and uniformity, and tablet/capsule assay/content uniformity, among others. NIR and Raman spectroscopy are complementary techniques in many aspects. Detailed comparison of these two techniques is beyond the scope of this article. Some guidelines on selection of NIR and Raman analyzers can be found elsewhere [24]. The capabilities of NIR and Raman spectroscopy offer a wide range of opportunities to facilitate real time measurement of critical quality attributes to enable Continuous Quality Verification, improved control strategies, and Real Time Release (RTR). In recent RTR approvals by FDA and EMA, e.g. Pfizer’s Chantix and Pristiq, NIRS has played a critical role in supporting the RTR implementation strategy.
However, despite this successful track record, there still remain many challenges when applying these techniques in production or quality environments. Some of the factors that can influence the NIR and/or Raman method accuracy are depicted in the following Cause-and- Effect (Fishbone) diagrams, Figure 1.
As summarized in Figure 1, sampling, instrument, experiment, environment and modeling all contribute to the NIR and Raman method accuracy. The effect of these parameters should be carefully studied during method development and validation. The impact of some of these factors, are easier to correct than others. For instance, a wider selection of instruments with improved resolution/sensitivity is now available, environmental conditions during manufacturing are better controlled, and data acquisition settings can be optimized. Other factors, on the other hand, are more difficult to control and/or correct. Some of these challenging factors are light scattering in NIR and fluorescence in Raman. To achieve accurate method accuracy, the interference from these factors must be eliminated or minimized using appropriate sample presentation and/or math pre-treatments.

Light Scattering in NIRS
Samples that are measured using diff use reflectance or transmittance modes, particularly when using NIR analyzers, often exhibit significant differences in the spectra due to uncontrollable physical variations such as non-homogeneous distribution of the particles, changes in refractive index, particle size distribution, sample packing/density variability, and sample morphology (surface roughness/shape). This is particularly true in dynamic solid dosage processing, where powder samples can vary greatly in presentation, leading to light scattering effect. These factors contribute to varying sample/effective pathlength and result in additive, multiplicative and wavelength-dependent effects. Typically, wavelength-dependent scattering appears as baseline shifts, tilt or a curvature scaling variation in some instances, where the degree of influence is more pronounced for longerwavelength region of the spectrum. In fact, spectral measurements of samples from a given chemical matrix that exhibit variable physical characteristics can sometimes look completely different due to these phenomena, masking any subtle chemical variations. Such unwanted variations are unrelated to the chemical response, which can be detrimental to subsequent quantitative chemical analysis and lead to inaccurate results. Thus, it is critical to apply appropriate pretreatment to minimize such physical effects in order to model the chemical effect more effectively. It should be, however, noted that due to the impact of the physical properties on the spectral response, the NIRS can be used effectively to measure changes in such attributes as particle size distribution. When used for this purpose, the spectral baseline variations are used to model changes in physical property. The utilization of cross-sensitivity of NIRS for characterization of physical properties, e.g. particle size, has also been studied in the pharmaceutical industry [25].
The scattering effect in NIRS consists of the following: 1) Additive effect, which is reflected as a baseline off set (simple baseline shift) in NIR spectra; 2) Multiplicative effect (pure) that scales the entire spectrum by a given factor, for example due to. pathlength differences; 3) Wavelength-dependent baseline variation, where the degree of baseline shift varies with wavelength. Scattering is a complex phenomenon and could be linear or non-linear, making it difficult to minimize or remove. Martens et. al. pointed out that scattering correction can be done through implicit and explicit scatter correction [26]. Implicit correction using multivariate calibration, can to some extent compensate for unknown scatter variation at the expense of increasing model complexity (more components). However, bilinear methods (additive first-order approximation), e.g. PCA/PLS are not as effective for accommodating the impact of multiplicative scattering [26]. To minimize complex baseline variation more effectively, explicit scattering correction through appropriate data-pre-treatment are needed.
Fluorescence and Laser Fluctuations in Raman Spectroscopy
It should be noted that the effect of physical variation is not as prominent in Raman spectroscopy, which can be advantageous. However, other issues such as sample fluorescence and laser fluctuations can alter the integrity of the Raman signal. Raman fluorescence is produced by the emission of photons from low-lying excited electronic states. Fluorescence occurs when the frequency of the laser corresponds to the transition energy from the ground to an electronically excited state. The fluorescence signal tends to be much stronger than the Raman scattering and could overshadow Raman peaks by creating a broad band convoluted with the Raman signal [24]. The best way to avoid undesirable fluorescence is to employ Raman systems with longer wavelength lasers. Lasers which produce radiation with wavelengths longer than 785 nm usually reduce the contribution of the fluorescence signal, although in many cases not completely. The ability of extracting relevant information from a spectrum with florescence interference will greatly depend on the analyst experience and understanding of the sample. To correct for fluorescence effects, derivatives are usually employed to amplify the Raman signal while eliminating the fluorescence broad band signal [27]. However, as mentioned elsewhere [24], in very rare occasions the fluorescence signal of some pharmaceutical products can be so overwhelming that no spectral pre-treatment can extract the Raman signal.
Another factor impacting the implementation of Raman spectroscopy is laser fluctuations, particularly when monitoring long processes. Laser fluctuations will be reflected in the process data as an overall intensity shift. Laser fluctuations are easily corrected as long as the shift does not decrease the signal to noise of the spectra.
Why Pre-treatment?
The goal of data pre-treatment is to eliminate or minimize variability unrelated to the property of interest, so that pertinent changes can be more effectively modeled. For instance, in NIR blend monitoring, powder passes across the probe tip with varying sample presentations and physical properties. Therefore, to accurately measure blend potency, it is necessary to apply appropriate preprocessing to minimize physical effects prior to multivariate calibration. In such cases, the success of pre-treatment lies in how effectively the mathematical treatment can separate light scattering from light absorbance in NIRS.

The most commonly used preprocessing methods in spectroscopy are derivatives, de-trending, Standard Normal Variate (SNV) [27] and Multiplicative Scatter Correction (MSC) [27], while Extended Multiplicative Signal Correction (EMSC), OSC (Orthogonal Signal Correction) and Generalize Least Squares (GLS), have also started to gain popularity [26,28-30].
When analyzing spectral data, it is common for scientists to try out different pre-treatment and their combinations, and assess which pretreatment is better by comparing subsequent model performance. However, pre-treatment methods should be used with care, as they can help minimize unwanted variations, but could also reduce net analyte signal of interest. Thus, prior knowledge of pre-treatment and sample presentation is more desired than random trials of various pretreatment algorithms.
In the following sections, the aforementioned pre-treatment methods will be evaluated through a simulation study, as well as industrial examples. Collectively, they can provide practical guidance for a better understanding of appropriate data pre-treatment methods, and their selection in different applications.
Data Pre-treatment Methods
This article will only cover several commonly used methods, namely derivatives, de-trending, Standard Normal Variate (SNV) and Multiplicative Scatter Correction (MSC), as well as Extended Multiplicative Signal Correction (EMSC) that has not been used in industry as often, yet. The principles of these preprocessing methods have been discussed previously in literature [26,28-31], and will only be briefly described here.
Derivatives
Derivatives are among the most common signal pre-treatments applied to spectral data. Derivatives are mainly used to resolve peak overlap (or enhance resolution) and eliminate constant and linear baseline drift between samples. First and second derivatives are more common in practice than higher-order ones. Spectral derivatives can be calculated by obtaining the differences between two consecutive points, or by smoothing/differentiating, specified gap distance; or Savitzky-Golay polynomial fitting [32]. Some common disadvantages of applying derivatives are noise enhancement and difficult spectral interpretation.
De-trending (Baseline Corrections)
De-trending is performed through subtraction of a linear or polynomial fit of baseline from the original spectrum to remove tilted baseline variation, usually found in NIR reflectance spectra of powdered samples, and Raman spectra with fluorescence background reference.
Standard Normal Variate (SNV)
SNV is another frequently used pre-treatment method due to its simple algorithm and effectiveness in scattering correction. SNV is often used on spectra where baseline and pathlength changes cause differences between otherwise identical spectra. The method was proposed by Barne et.al [33]. Mathematically, it is identical to an autoscaling of the rows instead of the columns of the matrix.
Multiplicative Scatter Correction (MSC)
MSC correction is achieved by regressing a measured spectrum against a reference spectrum and then correcting the measured spectrum using the slope and intercept of this linear fit [34]. This pretreatment method has proven to be effective in minimizing baseline offsets and multiplicative effect. The outcome of MSC, in many cases, is very similar to SNV. Nevertheless many spectroscopist prefer SNV over MSC since SNV corrects each spectrum individually and does not need the entire data set. The comparison of these two methods was detailed in [27].
Extended Multiplicative Signal Correction (EMSC)
EMSC preprocessing method was first proposed by Martens et.al and it allows a separation of physical light-scattering effects from chemical absorbance effects in spectra from powders or turbid solutions [26,28], for example. The model-based method is particularly useful in minimizing wavelength-dependent light scattering variation. After pre-treatment the corrected spectra become insensitive to light scattering variations and responds linearly to the analyte concentration. The mathematical description of EMSC is given below [26].
A measurement spectrum, , can be approximated by the sum of baseline offsets, ideal chemical absorbance per beer’s law, and wavelength-dependent variations, and written as
xi ≈ ai + bixi,chem + diλ + eiλ2
where a: baseline offset; b: pathlength; d & e: wavelength-dependent variation
xi, Corrected = (xi - diλ - eiλ2) / bi
Through EMSC parameter estimation, an EMSC-corrected spectrum can be obtained, with only chemical absorbance part left after removal of baseline offset and wavelength-dependent variations.
Spectral Truncation
Spectral truncation is probably the simplest, but most effective pretreatment procedure in spectroscopy, if prior knowledge is available about the regions of interest. Truncating variations in the wavelength region that are unrelated to analyte of interest offers the following advantages: 1) Eliminate unrelated variables/noise and keep related variables; 2) Simplify baseline variation in the selected wavelength region, i.e. baseline variation may be nonlinear in a broader range, but linear in the selected range; 3) Result in simpler and more robust models with fewer components.
A Simulation Study of Pre-treatment
A simulation study was carried out to evaluate the performance of the pre-treatment methods described in the previous section. In this study, artificial baseline variations were added to the spectra. For a simpler illustration, the unit in X-axis uses wavelength (nm) in the NIR region, but the examples equally apply to Raman spectra. The individual pre-treatment methods as well as their combinations were evaluated. Figure 2a shows three replicated spectra simulated with one Gaussian peak centered at 1200nm, and two overlapping peaks around 1700nm and 1800nm respectively. The three simulated spectra are ideal with no baseline variation and no noise at all, and therefore completely overlapped. Different extents of artificial additive and multiplicative effects were then added to three replicates individually, as seen in Figure 2b.
The simulated spectra with artificial scattering effect were preprocessed by SNV, MSC, 1st derivative, 2nd derivative and the combination of 2nd derivative and SNV. As shown in Figure 3, both SNV and MSC were successful in completely eliminating scattering effect. All three replicates are overlapping entirely as they are supposed to be. The 1st derivative or 2nd derivate alone clearly was unable to entirely correct for the scattering effect. The combination of 2nd derivate and SNV in either order, however, has totally corrected for the scattering effect. EMSC was also successful in eliminating the scattering effect (graph not shown here for brevity).
In the above example, there was no wavelength-dependent baseline variation, which however occurs quite often in NIRS applications, especially for solid powder samples. To further evaluate the performance of the pre-treatment methods, different degree of 2nd order non-linear baseline variations and additional offsets were added to the three spectra shown in Figure 2b. See Figure 4.
It is clear in Figure 5 that 2nd derivative, SNV, or MSC by themselves are not capable of removing non-linear wavelength-dependent variations, which however can be totally eliminated by EMSC. The use of this technique results in all scattering effects being removed from the three replicates that become exactly the same, after pre-treatment.
It is interesting to compare a combination of pre-treatment in different orders. The spectra shown in Figure 4 were preprocessed by the combined SNV and 2nd derivative. It is obvious that the order of pretreatment makes difference. As seen in Figure 6, SNV followed by 2nd derivative was not able to remove the scattering effect, while the reverse order, 2nd derivative followed by SNV, worked successfully. Other combinations of pre-treatment can be tested in a similar fashion.
It is useful to see that both EMSC and 2nd derivative followed by SNV appear more effective than the other pre-treatment in removing wavelength-dependent baseline variations. In real-world applications, the spectra are more complex, with noise and possible different orders of non-linear baseline variations. The derivatives are certainly more sensitive to noise, with a possibility of leading to more noisy spectra. All these additional factors should be taken into considerations when selecting appropriate pre-treatment.
Real-world Application Examples of Pre-treatment
Pre-treatment for NIRS in Drug Product Manufacturing
In drug product manufacturing, NIRS has seen a wide range of applications in tablet assay, blend uniformity and granulation monitoring etc. Figure 7 shows NIR spectra of tablets (3 replicates) of two different strength/sizes manufactured using two levels of compression forces. The process steps prior to compression were all the same. As can be seen, there is a drastic difference between two sets of tablets in terms of scattering effect, evident by significant baseline variation. Clearly, the scattering effect was caused by physical variations such as envelope density between two sets of tablets. To model chemical effect accurately, appropriate pre-treatment needs to be applied. It is understood that the two sets of tablets in principle should contain the same concentration levels of API, as well as excipients. In other words, they all should be chemically identical, assuming all ingredients are evenly distributed in the tablets and NIR measurement is optimal. It is clear that only EMSC and the combination of 2nd derivative followed by SNV are successful in minimizing the scattering effect in the truncated API wavelength region, whereas 2nd derivative, SNV and MSC alone have failed to remove the physical difference, as shown in Figure 8 and 9.

Figure 10 shows NIR spectra of granules at end of granulation (prior to addition of extragranula), final tabletting blend and tablet. Chemically, final tabletting blend and tablet should be the same. The granules from end of granulation should contain higher concentration of API than the tabletting blend and the tablets. Pre-treatment methods were applied to a truncated wavelength region related to API (1450-1600nm), Figure 10b. None of SNV, MSC and derivatives alone worked well (not shown here for brevity). The 2nd derivative followed by SNV appears to have overcorrected or eliminated the API variation between granules and tabletting blend/tablets, which should have been preserved, Figure 10c. The best performance comes from EMSC, which pre-processed the spectra correctly and separate granules from tabletting blend/tablets in the API band while having minimized scattering between tabletting blend and tablet, Figure 10d. The API peak (around 1500nm) of the tabletting blend and the tablet are almost completely overlapped, while that of the granules at end of granulation clearly shows higher intensity attributed to higher concentration of API. It is therefore possible that calibration could be built based on powdered samples and used for much denser forms such as tablets, as long as the physical difference can be effectively removed by appropriate pre-processing.

Pre-treatment in Raman Spectroscopy
Raman spectrometers are also becoming popular analyzers to monitor drug substance and drug product manufacturing processes. Raman spectroscopy is commonly employed as a bench top analytical technique in chemical and physical characterization laboratories. A very useful application of Raman in the pharmaceutical industry is solid state characterization [35]. The solid state of active pharmaceutical ingredient (API) is an important quality attribute as it can affect the manufacturability, stability and bioavailability of a product. Detecting spectral changes due to differences in API solid state content can be challenging since, on many occasions, these changes are subtle. Figure 11 shows the raw Raman spectra of a product with different ratios of two different API solid states. These spectra were obtained with a 785 nm defocused-macro beam spot size Raman. To the untrained eye, these spectra may appear to have no differences besides a baseline shift that arises from differences in sample fluorescence. Nevertheless, these spectra are not identical particularly in the aromatic region. One of the main advantages of Raman spectroscopy over NIR is that APIs usually exhibit bands in the amide and aromatic regions whereas the excipients do not. This allows investigating the API solid state in a drug product without excipient interferences [35].
One of the most important pre-treatment when dealing with Raman spectral analysis, particularly for solid state investigation of process induced transformation, is spectral truncation. Since Raman measures the fundamental vibrational modes, it exhibits sharp peaks which can be easily assigned to the different ingredients of a pharmaceutical matrix. By truncating the spectral data to the spectral region of interest prior to a calibration, variability associated with excipient peaks, and even content uniformity differences, can be eliminated. Such optimized data truncation often allows the creation of simpler and robust calibration models. It is also important to mention that in Raman data with fluorescence interference, pre-treatments such as SNV and de-trending (baseline corrections) work better when applied to shorter spectral regions.
Figure 12 shows the spectral data of two samples after truncating the spectra to the API region of interest and applying SNV followed by a simple baseline correction. As shown in the figure, the pre-treatments make it easier to observe the spectral changes attributed to differences in the API solid state content.
When using Raman for other purposes such as content uniformity and blend uniformity, information from the excipients cannot be removed, as it is imperative to determine drug peak to excipients ratio, which is the basis of content uniformity analysis. Overall ingredient signal variability is also important for blend uniformity determination [36].
Other pre-treatments such as first and second derivatives are commonly applied to Raman data. When applying derivatives to data sets in which the phenomenon of interest is observed as subtle spectral changes, caution should be exercised. Derivatives amplify noise and noise variability contribution can interfere with the weak systematic variation of interest. As aforementioned, the amplification of random noise is usually smoothed by using smoothing algorithms but unfortunately, when dealing with subtle spectral changes smoothing routines could smooth away the sought information.

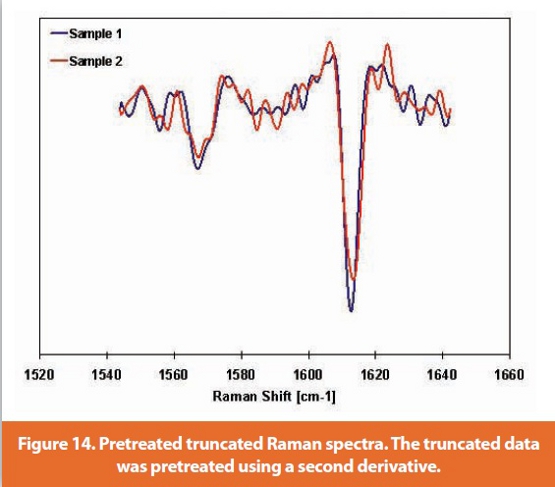
Figure 13 shows the API region of interest after applying a first derivative. It can be observed how the first derivative corrected the spectral baseline differences but amplified spectral noise. Figure 14 shows how a second derivative amplified noise even further. This exercise demonstrates how careful the analyst should be when analyzing data with subtle systematic changes.
For content uniformity and blend uniformity determination derivatives are commonly employed since spectral changes arise form chemical differences rather than from physical differences. Figure 15 shows the derivatized (second derivative) spectra of two samples with differences in their total API load. In the depicted spectral window it can be observed that, when the API load increases, the intensity of the API peaks increase while the excipient peaks decrease.

Conclusion
It was demonstrated through a simulation study, as well as industrial examples that in NIR and Raman spectroscopy, selection of appropriate math pre-treatment suited for subsequent multivariate calibration should be handled with care. It is important to recognize that various pre-treatments exhibited different effectiveness in minimizing/eliminating unwanted variations, depending on the objectives of the spectral analysis and sources of baseline variations. Light scattering due to physical variation commonly interferes with modeling of chemical responses in NIRS, while fluorescence and laser fluctuations could alter the Raman signal. An inappropriate use of a pre-treatment could lead to misinterpretation of the data and inaccurate results. For instance, SNV or MSC would not work well for wavelength-dependent baseline variation in NIRS, but either EMSC or a combined 2nd derivative followed by SNV works better. The order of combined pre-treatments makes a difference. The derivatives are more sensitive to noise, with a possibility of leading to more noisy spectra. If prior knowledge is available, spectral truncation is simple and effective in removing unrelated variations. All these factors should be taken into considerations when selecting appropriate pre-treatment.
Acknowledgement
The authors would like to gratefully acknowledge Steve Hammond, Head of PASG, for his valuable input and support.
Reference
1. Wikström H, Romero-Torres S, Wongweragiat S, Stuart-Williams JA, Grant ER, Taylor LS: On-Line Content Uniformity Determination of Tablets Using Low-Resolution Raman Spectroscopy. Applied Spectroscopy 2006, 60:672-681.
2. Wikström H, Marsac P, Taylor L: In-Line Monitoring of Hydrate Formation During Wet Granulation Using Raman Spectroscopy. J Pharm Sci 2005, 94:2009.
3. Sulub Y, Wabuyele B, Gargiulo P, Pazdan J, Cheney J, Berry J, Gupta A, Shah R, Wu H, Khan M: Real-time on-line blend uniformity monitoring using near-infrared reflectance spectrometry: a noninvasive off-line calibration approach. J Pharm Biomed Anal 2009, 49(1):48-54.
4. Short SM, Cogdill RP, Wildfong PL, Drennen JK, 3rd, Anderson CA: A near-infrared spectroscopic investigation of relative density and crushing strength in fourcomponent compacts. J Pharm Sci 2009, 98(3):1095-1109.
5. Scott B, Wilcock A: Process analytical technology in the pharmaceutical industry: a toolkit for continuous improvement. PDA J Pharm Sci Technol 2006, 60(1):17-53.
6. Romero-Torres S, Pérez-Ramos JD, Morris KR, Grant ER: Raman Spectroscopic Measurements of Tablet-to-Tablet Coating Variability. Journal of Pharmaceutical and Biomedical Analysis 2005, 38:270.
7. Rantanen J, Antikainen O, Mannermaa JP, Yliruusi J: Use of the near-infrared reflectance method for measurement of moisture content during granulation. Pharm Dev Technol 2000, 5(2):209-217.
8. Popo M, Romero-Torres S, Conde C, Romañach RJ: Blend Uniformity Analysis Using Stream Sampling and Near Infra-red Spectroscopy,. AAPS Pharmaceutical Sciences and Technology 2002, 3:24.
9. Peroza-Meza C, Santos MA, Romañach RJ: Quantitation of Drug Content in a Low Dosage Formulation by Transmission Near Infrared Spectroscopy. AAPS Pharmaceutical Sciences and Technology 2006, 7:29.
10. Perez-Ramos JD, Findlay WP, Peck G, Morris KR: Quantitative analysis of film coating in a pan coater based on in-line sensor measurements. AAPS PharmSciTech 2005, 6(1):E127-136.
11. Mattes RA, Root DE, Birkmire AP: In-line Process Analysis of Residual Moisture in a Fluid Bed Granulator-Dryer Using NIR Spectroscopy. wwwspectroscopyonlinecom 2005:14.
12. Lin TP, Hsu CC: Determination of residual moisture in lyophilized protein pharmaceuticals using a rapid and non-invasive method: near infrared spectroscopy. PDA J Pharm Sci Technol 2002, 56(4):196-205.
13. Kirsch JD, Drennen JK: Nondestructive tablet hardness testing by near-infrared spectroscopy: a new and robust spectral best-fit algorithm. J Pharm Biomed Anal 1999, 19(3-4):351-362.
14. Kirsch JD, Drennen JK: Near-infrared spectroscopic monitoring of the film coating process. Pharm Res 1996, 13(2):234-237.
15. Kirsch JD, Drennen JK: Determination of film-coated tablet parameters by nearinfrared spectroscopy. J Pharm Biomed Anal 1995, 13(10):1273-1281.
16. Jedvert I, Josefson M, Langkilde F: Quantification of an active substance in a tablet by NIR and Raman spectroscopy. Journal Near Infrared Spectroscopy 1998, 6:279.
17. Hausman DS, Cambron RT, Sakr A: Application of Raman spectroscopy for on-line monitoring of low dose blend uniformity. Int J Pharm 2005, 298(1):80-90.
18. Hausman DS, Cambron RT, Sakr A: Application of on-line Raman spectroscopy for characterizing relationships between drug hydration state and tablet physical stability. Int J Pharm 2005, 299(1-2):19-33.
19. Hailey PA, Doherty P, Tapsell P, Oliver T, Aldridge PK: Automated system for the online monitoring of powder blending processes using near-infrared spectroscopy. Part I. System development and control. J Pharm Biomed Anal 1996, 14(5):551- 559.
20. Hagrasy AE, Chang S-Y, Desai D, Kiang S: Application of Raman Spectroscopy for Quantitative In-Line Monitoring of Tablet Coating. American Pharmaceutical Review 2006.
21. Gupta A, Peck GE, Miller RW, Morris KR: Real-time near-infrared monitoring of content uniformity, moisture content, compact density, tensile strength, and Young’s modulus of roller compacted powder blends. J Pharm Sci 2005, 94(7):1589-1597.
22. Eustaquio A, Graham P, Jee R, Moffatt A, Trafford A: Quantification of paracetamol in intact tablets using near-infrared transmittance spectroscopy The Analyst 1998, 123:2303.
23. El-Hagrasy AS, Drennen JK, 3rd: A Process Analytical Technology approach to nearinfrared process control of pharmaceutical powder blending. Part III: Quantitative near-infrared calibration for prediction of blend homogeneity and characterization of powder mixing kinetics. J Pharm Sci 2006, 95(2):422-434.
24. Romero-Torres S, Huang J, Hernandez P: Practical considerations in PAT analyzer selection: NIR vs.Raman. American Pharm Review 2009.
25. Abhay G, Garnet EP, Ronald WM, Kenneth RM: Nondestructive measurements of the compact strength and the particle-size distribution after milling of roller compacted powders by near-infrared spectroscopy. Journal of Pharmaceutical Sciences 2004, 93(4):1047-1053.
26. Martens H, Nielsen JP, Engelsen SB: Light Scattering and Light Absorbance Separated by Extended Multiplicative Signal Correction. Application to Near- Infrared Transmission Analysis of Powder Mixtures. Analytical Chemistry 2003, 75(3):394-404.
27. Dhanoa MS, S. J. Lister RS, Barnes RJ: The Link between Multiplicative Scatter Correction (MSC) and Standard Normal Variate (SNV) Transformations of NIR spectra. Journal of Near Infrared Spectroscopy 1994, 2:43.
28. Martens H, Stark E: Extended multiplicative signal correction and spectral interference subtraction: New preprocessing methods for near infrared spectroscopy. Journal of Pharmaceutical and Biomedical Analysis 1991, 9(8):625-635.
29. A, Aragay M, Tauler R: Comparison between different data pre-treatment methods in the analysis of forage samples using near-infrared diffuse reflectance spectroscopy and partial least-squares multivariate calibration method. Analytica Chimica Acta 2003, 484(1):121-134.
30. Pizarro C, Esteban-Díez I, Nistal A-J, González-Sáiz J-M: Influence of data preprocessing on the quantitative determination of the ash content and lipids in roasted coffee by near infrared spectroscopy. Analytica Chimica Acta 2004, 509(2):217-227.
31. Chen Z-P, Morris J, Martin E: Extracting Chemical Information from Spectral Data with Multiplicative Light Scattering Effects by Optical Path-Length Estimation and Correction. Analytical Chemistry 2006, 78(22):7674-7681.
32. Savitzky A, Golay MJE: Smoothing and Differentiation of Data by Simplified Least Squares Procedures. J Anal Chem 1964, 36:1627.
33. Barnes RJ, Dhanoa MS, Lister SJ: Standard Normal Variate Transformation and De-trending of Near-Infrared Diffuse Reflectance Spectra. Appl Spectrosc 1989, 43(5):772-777.
34. Martens H, Naes T: Multivariate calibration: John Wiley & Sons Ltd; 1989.
35. Taylor L, Zografi G: The Quantitative Analysis of Crystallinity Using FT-Raman Spectroscopy. Pharm Res 1998, 15:755-761.
36. Sekulic SS, Ward HW, Brannegan DR, Stanley ED, Evans CL, Sciavolino ST, Hailey PA, Aldridge PK: On-Line Monitoring of Powder Blend Homogeneity by Near-Infrared Spectroscopy. Analytical Chemistry 1996, 68:509.
Author Biography
Jun Huang is Principal PAT Scientist II at Pfizer’s Process Analytical Sciences Group, NJ. He is currently responsible for the implementation of QbD/PAT in support of manufacturing of drug product, API as well as nutritionals. Prior to joining Pfizer, he worked at legacy Wyeth, GlaxoSmithKline and PerkinElmer. He received his PhD in chemometrics from the Norwegian University of Science and Technology in Norway, 2001, with Prof. Kim Esbensen.
Saly Romero-Torres is currently working as PAT Scientist at Pfizer Pharmaceuticals. She holds a PhD in Analytical Chemistry which she completed at Purdue University (West Lafayette, IN) in 2006. Her dissertation title is “Raman and Chemometrics for Pharmaceutical Process Analysis”. Before joining Pfizer (legacy Wyeth), she worked at Schering- Plough Pharmaceuticals as a spectroscopist in a physical characterization team. At Schering Plough, she developed new spectroscopic (IR, NIR and Raman) and chemometrics based analytical methods aimed to characterize and understand chemical and physical attributes that were critical to the quality of pharmaceutical materials.
Mojgan Moshgbar leads the Innovative Processes Team in PASG, Pfizer, with responsibility to support advanced PAT applications in Continuous DP, API, and nutritional powder manufacturing that can enable real-time process control, RTR and CQV. Her team is also currently responsible for development and implementation of Advanced Process Control strategies in Pfizer Global Manufacturing.