In recent years, Raman Spectroscopy has gained a reputation in market segments that require the rapid identification of unknown compounds, such as the testing of high purity chemicals, measurement of pharmaceutical ingredients and the characterization of polymer materials. The reasons behind this surge of interest, is that modern Raman instrumentation using intelligent decision-making software and on-board spectral libraries, is an ideal technique for molecular fingerprinting purposes. Unlike traditional analytical techniques like HPLC, FTIR and NIR spectroscopy, which are more time consuming and often require more exhaustive sample preparation procedures, Raman equipment can be used in a production environment or for field applications because it requires virtually no sample pre-treatment, no direct contact with the sample, and has the unique capability of being able to test a sample directly through a transparent packing material like glass or plastic.
Today’s Raman instrumentation is faster, more rugged, less expensive and with the advances in component miniaturization, it has led to the design of high performance, portable and handheld devices. In particular, the reduction in size has introduced the technology to new application areas that were previously not possible with the older, larger and more cumbersome instruments. Handheld Raman instruments are very well-suited for pharmaceutical applications such as the testing of raw materials, verification of final products [1] and the identification of counterfeit drugs due to the technique’s extremely high molecular selectivity [2].
Principles of Raman Spectroscopy
Similar to infrared (IR) absorption techniques, Raman spectroscopy measures vibrational, rotational, and other low frequency modes of a molecule. While IR spectroscopy is based on focusing a broad range of IR wavelengths of light onto the sample and measuring which ones are absorbed, a Raman spectrum is obtained by directing a single wavelength of light and collecting the resulting “scattered” light. The frequencies of the scattered light depend on the bond strength of the molecules, the mass of the bound atoms, and other factors such as intermolecular interactions. The pattern of vibrational and rotational frequencies from a molecule is highly characteristic of a given molecular species or the structural arrangement of those molecules [3].
A typical laboratory Raman analyzer consists of five major components: a source of strong monochromatic light to excite the sample such as a laser, the collection/focusing device, the spectrograph, the detector and the post-processing software. The technique relies on molecules in the sample inelastically scattering the incident laser light, and the scattered light is then collected and analyzed using a Raman spectrometer to produce a spectrum. Raman spectra are generally well-resolved and rich in features enabling unambiguous identification of molecular compounds. But it is important to note that many materials experience auto–fluorescence when excited by a laser source, which interferes with the Raman signal and often reduces the capability to acquire an interference-free Raman signature of a given material. So unless the spectrometers post-processing algorithms are designed to compensate for these potentially significant interferences, the generated data can often be misleading and difficult to interpret.
Testing of Pharmaceutical Products
Traditionally, the quality control of incoming raw materials has typically involved in-line monitoring equipment or the use of portable infrared-based spectroscopic equipment to carry out the testing of selected batches of the chemical ingredients. In addition, verification of the final pharmaceutical product requires far more stringent methods, and as a result has traditionally been done by highly skilled analytical chemists who have to carry out extraction procedures and analyze the compounds using complex and time-consuming techniques like wet chemistry, liquid chromatography or mass spectroscopy.
Even though this approach has worked reasonably well, it is extremely slow, has not proved to be cost-effective and also creates huge sampling bottlenecks, especially as the FDA is encouraging all drug companies to test every raw material that comes into their manufacturing facility. For this reason, analytical instrumentation companies have been working with the pharmaceutical industry to develop innovative solutions to replace current testing procedures, with the goal of increased testing while reducing overall costs.
The technology that has proved itself to be the best fit for this type of work is Raman spectroscopy, which has the ability to rapidly determine whether the contents of a container of raw material or final pharmaceutical product is authentic based on spectral comparisons to built-in libraries. And with the recent development of small, handheld devices, the technique can be used in any location of the manufacturing plant to provide the operator with an immediate answer to a material’s chemical validity.
Current Challenges
The performance of handheld Raman instrumentation has improved so dramatically in the past few years that it is now being used to test for more complex compounds, such as differentiating between different binding/ tableting materials used in the pharmaceutical industry like cellulose, microcrystalline cellulose, hydroxypropyl methylcellulose (HPMC) and calcium hydrogen phosphate materials, as well as characterizing food additives such as maltodextrin and lactose. Historically, identification of these types of compounds have only been achievable using research-grade, laboratory systems, which offer high resolving power and better signal to noise capability. The inherent problem is that due to the high fluorescence nature of compounds like HPMC, cellulose materials, and saccharide-based food additives, the Raman characteristics are not distinctive enough. The challenge that the industry currently faces using traditional handheld Raman systems is relatively poor selectivity and extremely long testing times, which leads to reliability problems and inconsistencies in the testing methods.
However, recent breakthroughs in the areas of optical design, detectors, thermo-electric cooling technology and intelligent software algorithms, are proving that high performance Raman spectroscopy can now be combined with simplicity and ease of use in a compact design. To exemplify this, we carried out an investigation into the suitability of a recently commercialized hand-held Raman spectrometer, designed for the rapid identification of raw materials, to see if it could differentiate between a group of cellulose materials and food additives.
All the data presented in this study was carried out on a standard NanoRam® handheld Raman spectrometer (B&W Tek, Newark, DE) [4]. The NanoRam has been described in the open literature, but is basically a compact, handheld Raman spectrometer and integrated computing system for material identification and verification within cGMP compliant facilities [5]. Weighing less than 2.2lbs, it allows rapid development of standardized and validated methods for purity and quality control applications. Confirmation of an unknown compound is achieved in less than 20 seconds, making it a practical choice for pharmaceutical identification and verification purposes [6].
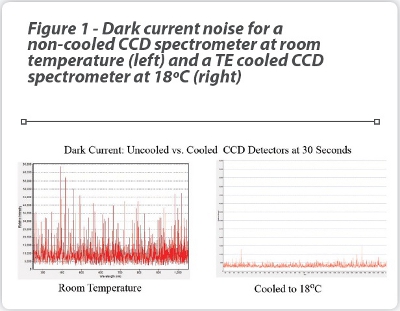 At the heart of the device is a 785 nm wavelength laser excitation source with a crossed Czerny-Turner spectrograph and a thermoelectrically (TE)- cooled CCD detector, providing a very stable signal with low background noise. The benefits of a temperature-controlled detector to reduce background noise is emphasized in Figure 1, which shows the dark counts (noise) for a non-cooled CCD spectrometer at room temperature and a TE cooled spectrometer, operated at 18ºC, using an integration time of 30 seconds. The calculated RMS (root mean square) noise level of the TE cooled spectrometer on the right is approximately five-fold lower than the non-cooled unit [7].
Coupling thermoelectric cooling with patented laser stabilization technology and high speed microprocessor, this technology provides laboratory grade performance in a convenient handheld package. It has the capability of generating a signal with high signal to background noise specification, which is required for the successful testing and confirmation of different pharmaceutical cellulose compounds and food additives.
Characterization of Different Materials and Additives used in the Pharmaceutical and Food Industry
The following materials used as binding agents, fillers, additives and supplements (all similar-looking white powders) were selected for this investigation:
- 2 types of Cellulose materials (binders/fillers)
· Cellulose
· Microcrystalline cellulose (Avicel)
- 5 types of Hydroxypropyl Methylcellulose (HPMC) Compounds (binders/fillers)
· Methocel #1
· Methocel # 2
· Methocel # 3
· Metolose
· Hypromellose
- Lactose (sweetening agent/filler)
- Maltodextrin (sweetening agent/food additive)
- Calcium Monohydrogen Phosphate dihydrate (CaHPO4.H2O) (binder/dietary supplement)
Testing Procedure
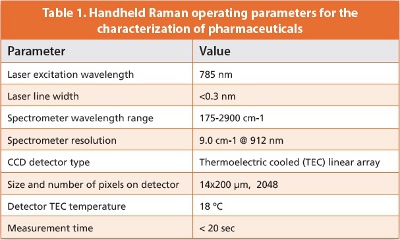 The standard operating parameters used for this study are shown in Table 1.
The testing procedure involves calibrating the device using pure forms of each of the compounds to develop and store methods to test and characterize all the other materials. Each instrument “method” collects a minimum of 20 scans from the specific type of material which allows a user to include slight variations in sampling position, packaging materials/ and batches, in addition to inconsistencies associated with many different operators carrying out the testing. Included in the customized method for each material, is a proprietary software algorithm where the Raman spectrum is compared and matched with that in the method to generate a numerical P-value from which the PASS/FAIL result is determined. The methods created in this way will not only be related to the unique characteristics of the materials, but will also ensure a rugged and robust method for a reliable testing procedure required for unambiguous material identification. Once a method is developed, the total scan time and decision making process takes approximately 20 seconds to make a PASS/ FAIL assessment of a material. 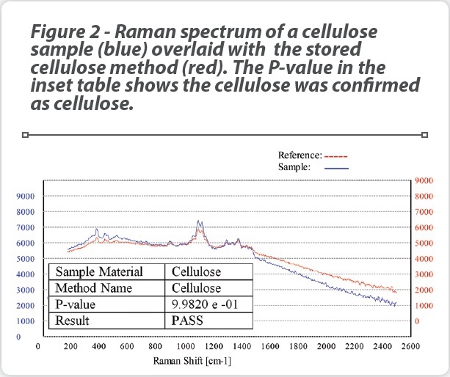
An example of a scan using this procedure is seen in Figure 2, which shows a Raman scan of a cellulose material (blue plot) using the stored “Cellulose Method” generated from a reference standard which is an average of 20 Raman scans of cellulose material (red plot) . It can be seen that a P-value of 0.9982 has been obtained, which is considered an extremely good fit compared to the reference material (a P-value of 1.000 is considered a perfect fit). It should be noted that the Raman spectra of the pure cellulose reference material has been off-set by 1000 intensity units compared to the unknown sample for clarity purposes. This unknown sample would therefore be assessed as a PASS for cellulose.
By comparison, Figure 3 shows a Raman scan of cellulose using a standard method generated for HPMC. It can be seen very clearly that the Raman spectrum for the sample (blue) looks very different from the HPMC reference scan (red), as indicated by the P-value for the sample, which is 2.23716 -e 06. This unknown sample would therefore be assessed as a FAIL for HPMC. 
If a sample material has failed, the software algorithm then makes a “probable” assessment of the material’s identification based on the library of methods and stored spectral information. This is exemplified in Table 2, which shows all the materials being tested using the “Cellulose Method.” Both the cellulose and microcrystalline cellulose PASS the cellulose ID test, whereas all the other materials FAIL it. However, the materials that failed the cellulose test are further evaluated against the on-board spectral libraries and confirmed as the correct material with almost 100% accuracy, based on the Hit Quality Index (HQI) in the final column. The HQI nomenclature is well-recognized for assessing Raman spectra and is defined as the similarity of two spectra, when comparing an unknown spectrum and a library spectrum via a correlation test. An HQI value of 1.00 (100%) indicates when the unknown spectrum is identical to the library spectrum, and gets smaller as the unknown and library spectra become less similar to one another [8]. In fact for all the materials that failed a specific method test, the average HQI value was >97%, indicating that the match of the unknown spectrum to a known reference spectrum in the library was extremely accurate.
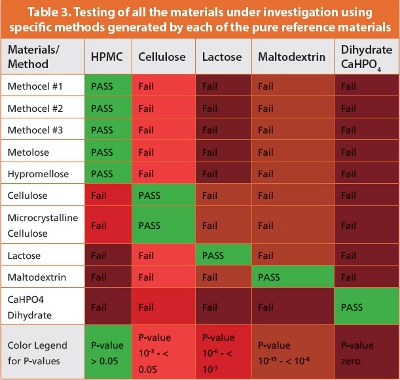
The final part of the investigation was to test all the powders using specific methods generated by each of the pure reference materials. The results of this test are shown in Table 3. It can be seen from the color-coded boxes that the handheld Raman system has correctly confirmed all the materials that were tested using their respective methods as indicated by the green PASS boxes; while all the other materials all FAILED the test, as indicated by the red and brown colored boxes. It’s worth pointing out that the color legend below the table shows the actual P-value ranges emphasizing the severity of the failure – in other words, the lower the value, the worse the failure. 
Conclusion
 This investigation has clearly emphasized that raw materials and additives used in the pharmaceutical and food industries can be successfully tested and identified using handheld Raman technology with a high degree of confidence in less than 20 seconds. It has also shown that even when a compound fails a test, the software algorithms and on-board spectral libraries can make a very accurate assessment of the probable identification of that compound. These capabilities make the technique ideally-suited for the unambiguous identification and verification of incoming raw materials in a pharmaceutical or food manufacturing environment.
References
1. An Implementation Perspective on Handheld Raman Spectrometers for the Verification of Material Identity: B. Diehl, C.S. Chen, B. Grout, J. Hernandez, S. O’Neill, C. McSweeney, J. M. Alvarado and M. Smith, Pfizer Inc; European Pharmaceutical Review, Non-destructive Materials Identification Supplement, Volume 17, Issue 5, 2012, http://www. europeanpharmaceuticalreview.com/wp-content/uploads/Raman- Supplement-2012.pdf
2. Portable Raman Spectroscopy for Pharmaceutical Counterfeit Detection: R. Kalyanaraman, M. Ribick and G. Dobler, Bristol-Myers Squibb; European Pharmaceutical Review, Non-destructive Materials Identifi cation Supplement, Volume 17, Issue 5, 2012; http://www. europeanpharmaceuticalreview.com/wp-content/uploads/Raman- Supplement-2012.pdf
3. Fundamentals of Raman Spectroscopy: T. Thompson, Laser Focus World, Editorial Digest, September, 2011; http://bwtek.com/wp-content/ uploads/downloads/2012/06/Appnote_Fundamentals_of_Raman_ Spectroscopy.pdf
4. The NanoRam Hand-held Raman Spectrometer: Ideally-suited for the Inspection of Raw Materials and Chemicals Used in the Pharmaceutical industry: B&W Tek Application Note; http://bwtek.com/wp-content/ uploads/downloads/2012/06/Appnote_NanoRam_Inspection.pdf
5. The NanoRam Hand-held Raman Spectrometer: Full Regulatory Compliance for the Inspection of Raw Materials and Chemicals Used in the Pharmaceutical Industry: B&W Tek Application Note; http://bwtek. com/wp-content/uploads/downloads/2012/06/Appnote_NanoRam_ Compliance.pdf
6. Small But Perfectly Formed: World Pharmaceutical Frontiers; http:// www.worldpharmaceuticals.net/marketresources/021/WPF021_ bandwtek.html
7. Advantages of TE cooled miniature fi ber optic spectrometers for Raman and Fluorescence spectroscopy: B&W Tek Application Note; http://www. photonicsonline.com/article.mvc/TE-Cooled-Miniature-Fiber-Optic- Spectrometers-0002
8. Spectral Preprocessing for Raman Library Searching: J. Kaufmann, J.D. Rodrigues, L.F. Buhse, American Pharmaceutical Review, Volume 14, Issue 4, May/June 2011; http://www.americanpharmaceuticalreview. com/Featured-Articles/36904-Spectral-Preprocessing-for-Raman- Library-Searching/
Ms. Dawn Yang received her B.E. degree in Engineering Physics from Tsinghua University in Beijing, China, her M.S. degree in Ceramic Engineering from Alfred University in New York, and her MBA from the University of Delaware, The Lerner College of Business and Economics, in Newark, Delaware. She has over ten years of experiences in materials science research and engineering. She is currently the Sr. Application Scientist at B&W Tek, Inc. Ms. Yang has published two application notes on The Application Notebook of The Spectroscopy in 2008 and 2009.
Robert J. Thomas is principal of Scientific Solutions, a consulting company based in Gaithersburg, MD. He has worked in the field of atomic, molecular and mass spectroscopy for over 35 years, mainly for a major vendor of analytical Instruments. He has written over 80 technical publications and just completed his third textbook on mass spectroscopy. Rob holds a graduate degree in analytical chemistry from the University of Wales, in the UK, and was recently awarded a Fellowship of the Royal Society of Chemistry.