Rutgers University, Graz Institute of Technology
Introduction
Fluidized beds are extensively used in the pharmaceutical and other chemical industries either as a batch or continuous process for drying moist powders and granular solids. This is due to good mixing of solids and intensive heat and mass transfer between the solid and hot gas phases in the system. Generally, high energy input is required during this process to provide the latent heat of water evaporation, and thus on-line measurements become important to determine the optimal operation conditions in order to minimize energy usage. In the pharmaceutical industry, the drying step in many pharmaceutical production lines is often a bottleneck because this process is affected by many parameters and it is difficult to determine the time required to dry the materials as well as analytically verify that a predetermined end point has been reached. If the active pharmaceutical ingredient has a low melting point, controlling the drying process becomes more critical due to the sensitivity of the formulation to the temperature and the risk of compromising product quality and performance during drying.
Materials and Experimental Setup
In this work, moist dibasic calcium phosphate anhydrous (DCPA), was dried using a commercial spray fluidized bed dryer/granulator. The pore volume and the surface area of the DCPA material are 0.1mL/g and 16.5m2/g. We have classified the materials into fines (particle size < 106μm), medium (180μm > particle size > 106μm), and coarse (particle size > 180μm) using the sieving approach (see Figure 1), and examined the drying process for each size cut as well as mixtures in the bed. The experimental procedure includes a wetting stage and a drying stage. During the wetting stage, cold air flows through the bed to fluidize 3kg dry materials, and then water is spayed at 20mL/min in the bed until a predetermined moisture content is reached. During the drying stage, hot air flows through the bed at a predetermined air flux and drying temperature to evaporate the moisture from the materials. The pressure drops across the bed, the inlet and outlet air temperatures, the bed temperature and the outlet air humidity are measured as a function of time. We have varied the initial moisture content inside the pharmaceutical materials from 6% to 20% because in pharmaceutical manufacturing, fluidized bed drying is generally carried out after the wet granulation step and the moisture content in the wet granules is normally in this range. The impacts of air flow and air temperature on the drying process were also investigated. This provides us useful formation for the drying mechanisms given some specific powder/granule materials.
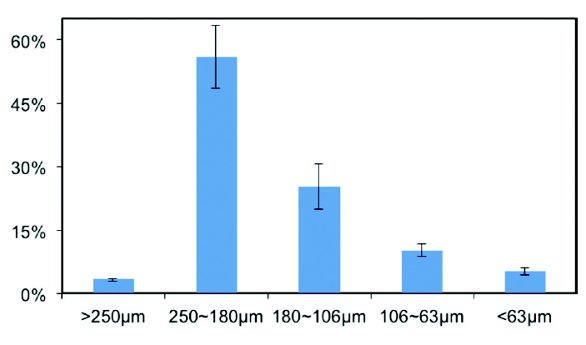 Figure 1. Particle size distribution of the dry DPCA materials.
Moisture Measurement
The moisture content in the product during drying was measured using two approaches: 1) Taking samples from the bed every 3 minutes, drying the samples in an oven at 80°C and calculating the sample moisture based on the mass loss before and after drying. This method is called Loss on Drying (LOD). 2) Using near-infrared spectroscopy (NIR) with partial least squares regression (PLSR) to predict DCPA’s residual moisture content during drying. DCPA is generally stable when contacting with water, and dry DCPA exhibits very weak signals in the NIR region. Therefore only water bands from the wet DCPA are mainly visible in the NIR spectra [2, 3]. Figure 2a illustrates that the intensity of the spectra of the water bands was declined steadily during drying. In order to correlate the NIR spectra to the sample moisture content, a PLSR model was established using the LOD measurement at T=60°C as a reference. Then the PLSR model was used to predict the sample moisture content based on the recorded spectral data at T=80°C. In Figure 2b, we have compared the NIR predictions and the LOD measurements for drying at T=60°C and T=80°C respectively, wheresamples represent the LOD measurements and lines represent NIR modeling. It is clear that the NIR prediction matched the LOD measurement quite well. This indicates that the NIR method can be used to accurately measure the product moisture content and to determine the end point of the drying process.
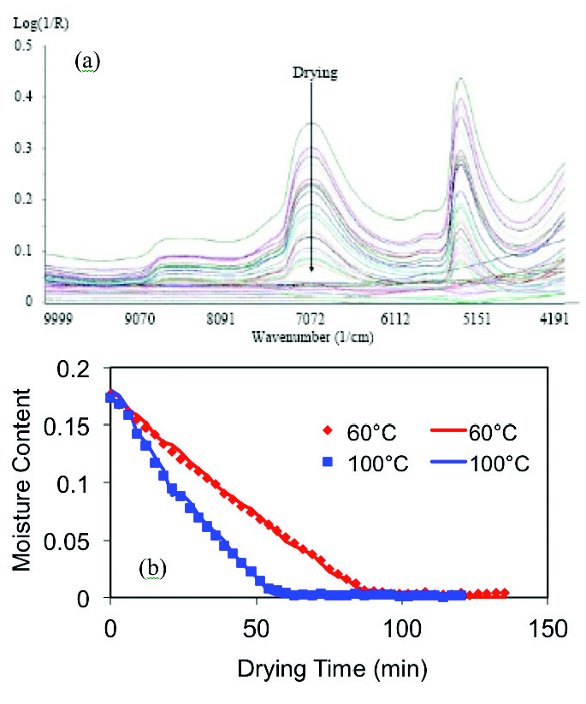 Figure 2. Moisture measurements during the drying process. a) NIR spectra, and b) comparison of loss-on-drying measurements and NIR predictions.
Impact of Particle Size
Figure 3 shows the variation of the moisture content and the bed temperature during drying for large particles, moderate particles and mixtures with a targeting moisture content of 20% and drying temperature of 80°C. The drying process for fine particles was also examined in this work. However during drying, the holes in the bed distributer were easily clogged by fine particles causing an unstable fluidization state. Therefore the results for fine particles are not shown in this article. Since a small amount of water is evaporated during the wetting stage, the moisture content at the beginning of the drying stage is smaller than 20%. The drying profiles shown in Figure 3 indicate that this fluidized bed drying process is a three stage process, including a short pre-heating stage, a constant rate stage and a falling rate stage. The constant rate stage corresponds to a constant bed temperature. The 0.1mL/g pore volume determines that if targeting 20% moisture content, 50% water is distributed inside the pores and 50% water is distributed in the voids of the bed. The water in the voids is evaporated first and this occurs during the constant rate stage. Once all the water in the bed voids is removed, convection drives the water inside the powder pores to flow towards the powder surface, and then water is evaporated at the surface. This surface evaporation also occurs at the constant rate stage. From Figure 3 we can see that more than 90% water was removed during the constant drying rate stage. With further drying, the effect of convection reduces due to the loss of water and the drying front starts to penetrate inside the pores. The drying process transits from the constant rate stage to the falling rate stage, and the bed temperature goes up. Once all the water is removed from the materials, a plateau can be observed for the bed temperature indicating that the system reaches an equilibrium state. This plateau temperature is less than the inlet air temperature due to the heat loss at the equipment walls. It is important to note that the profiles of the moisture content and the bed temperature were quite similar for large particles, moderate particles and mixtures. This indicates that if drying is dominated by the constant rate stage, the impact of powder size on drying is not significant.
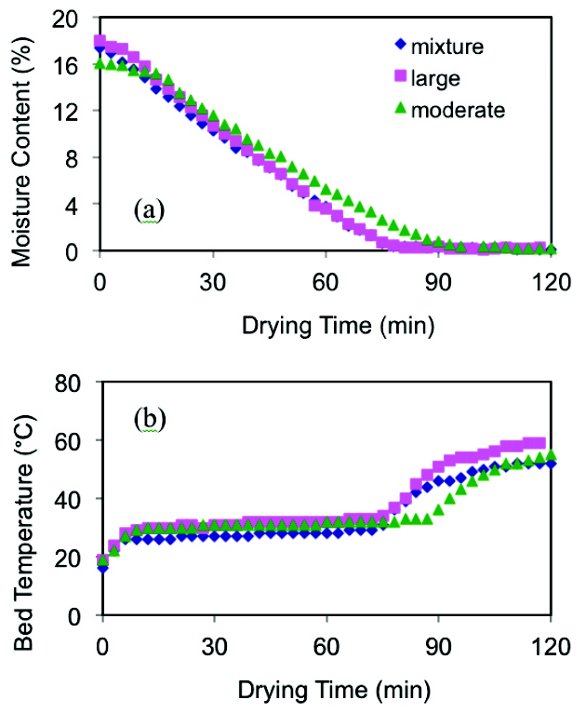 Figure 3. Eff ects of the particle size on the drying process with a targeting 20% moisture content (T = 80°C, air fl ux = 40m3/hr, dry DCPA loading = 3kg). a) sample moisture content vs. drying time, and b) bed temperature vs. drying time.
Similar results can be found in Figure 4 when the targeting moisture content was reduced to 10% and water was mainly distributed inside the pores after the wetting stage. Under this situation, more than 80% water was removed during the constant rate stage and drying was completed in 40 minutes for all three cases studied. Whether the constant rate stage dominates the drying process or the falling rate stage dominates the drying process is determined by the competition of the capillary flow rate inside the pores and the evaporation rate at the powder surface [4]. In a fast drying regime, where the vapor removal is faster than the capillary flow, the drying front moves quickly towards the particle center and the drying process is dominated by the falling rate stage. Under this situation, the effect of powder size on the drying time becomes significant and previous work has shown that drying of small particles is much faster than large particles [5]. In a slow drying regime, where capillary flow is faster than evaporation, water evaporation mainly occurs at the powder surface and the drying process is mainly dominated by the constant rate stage. Under this situation, the effect of particle size on the drying time is not significant. In pharmaceutical drying processes, if the API has a low melting point or is sensitive to heat, drying is generally carried out in a slow drying regime. During the constant drying rate stage, the water content in the bed linearly decreases with time indicating a zero order kinetics (see Figures 3a and 4a). If further decreasing the drying air flux to 20m3/hr, the drying rate was reduced and the constant rate stage was greatly elongated (see Figure 5). Under this situation, the drying profiles for three cases were overlapped and the effect of particle size on the drying process could be neglected.
 Figure 4: Eff ects of the particle size on the drying process with a targeting 10% moisture content (T = 80°C, air fl ux = 40m3/hr, dry DCPA loading = 3kg). a) sample moisture content vs. drying time, and b) bed temperature vs. drying time.
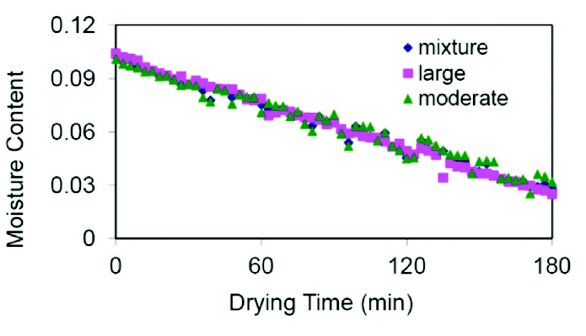 Figure5. Sample moisture content vs. drying time at a relatively low drying air fl ux (T = 80°C, air fl ux = 16m3/hr, dry DCPA loading = 3kg).
Conclusions
In this work, moist dibasic calcium phosphate anhydrous (DCPA) has been dried using a commercial fl uidized bed dryer. The moisture content was measured using two approaches: Lose on Drying (LOD) and NIR. A good match between the LOD measures and NIR predictions indicates that the NIR method can be used to determine the end point of the drying process. We also classifi ed the DCPA materials into fi nes, medium, coarse, and examined the drying process for each size cut as well as mixtures. Our results indicate that if drying is carried out in a slow drying regime, where capillary flow is faster than evaporation, drying is dominated by the constant rate stage and the impact of particle size on drying is not signifi cant.
Author biographies
Xue Liu, Ph.D., is an assistant research professor at Chemical Engineering Department of Rutgers University. He earned degrees in Chemical Engineering from Tsinghua University, China (B.S., M.S.) and Rutgers University (Ph.D.). He is currently a project manager of the NSF Engineering Research Center, and Associate Director of Catalyst Manufacturing Science and Engineering Center.
Fernando Muzzio, Ph.D., is currently a professor II at Chemical Engineering Department of Rutgers University. For more than 20 years, Professor Muzzio has focused upon pharmaceutical product and process design. He also directs the NSF Engineering Research Center on Structured Organic Particulate Systems. In this capacity, Dr. Muzzio directs research involving the U.S. FDA and more than 40 global companies. He has more than 200 peer-reviewed scientifi c articles, book chapters, and patents.
Johannes G. Khinast, Ph.D., is a Professor of Pharmaceutical and Process Engineering at Graz University of Technology, Austria. He earned degrees in Chemical Engineering from Graz University of Technology, Austria, (B.S., Ph.D.). He is currently Head of the Institute for Process Engineering and Scientifi c Director of the Research Center for Pharmaceutical Engineering.
Benjamin J. Glasser, Ph.D., is a Professor of Chemical and Biochemical Engineering at Rutgers University. He earned degrees in Chemical Engineering from the University of the Witwatersrand (B.S., M.S.) and Princeton University (Ph.D.). He is currently Director of the Pharmaceutical Engineering Program at Rutgers University.
References
- Nicolas Heigl, Daniel Koller, Benjamin J. Glasser, Fernando J. Muzzio, Johannes G. Khinast, Quantitative On-line vs. Off-line NIR Analysis of Fluidized Bed Drying with Consideration of the Spectral Background, in preparation, 2013.
- J. Märk, M. Karner, M. Andre, J. Rueland, C.W. Huck, Online process control of a pharmaceutical intermediate in a fluidized bed drier environment using near-infrared spectroscopy; Anal. Chem., 82, 4209-4215, 2010
- P. Frake, D. Greenhalgh, S.M. Grierson, J.M. Hempenstall, D.R. Rudd, Process control and end-point determination of a fluid bed granulation by application of near-infrared spectroscopy, Int. J. Pharm., 151, 75-80, 1997.
- A.V. Neimark, L.I. Kheifez, V.B. Fenelonov, Theory of preparation of supported catalysts, Ind. Eng. Chem. Prod. Res. Dev., 20, 439–450, 1981.
- X. Liu, J.G. Khinast, B.J. Glasser, A parametric investigation of impregnation and drying of supported catalysts, Chem. Eng. Sci., 63, 4517–4530, 2008.