Introduction
Under the U.S. FDA’s 21st-century Quality Initiative, formulators are encouraged to use the Quality by Design (QbD) approach to develop robust formulations and processes [1]. The adoption of QbD principles by the pharmaceutical industry has led to growing awareness of the profound influence that variability in excipient properties can have on quality and product consistency of finished dosage forms. Accounting for excipient variability is an essential part of the risk assessment needed to define the design space [2].
Excipients are synthetically made, derived from natural products or synthetically modified natural products, and are available from multiple vendors. As a result, their physical/chemical properties can vary from lot to lot and vendor to vendor. Excipient variability has been studied and, in some cases, found to have a significant effect on finished product quality. For example, Barra et al. examined the physiochemical properties and lubricity of 13 lots of Mg stearate (MgSt) from three different vendors [3]. They found that MgSt supplied by different vendors are unlikely to have the same physical properties, and variations in physical properties can be expected within lots supplied by the same vendor. The mean particle size of MgSt was found to be the key factor influencing its lubricant efficiency. The crystalline structure was also found to influence the compaction characteristics of the formulation, but with less impact than the mean diameter for the systems studied [3]. In addition, Hamad et al. found variability in physical properties of different types of MgSt and these differences can influence tablet ejection force [4]. Other studies by Gamble et al. reported on the batch-to-batch and vendor-to-vendor variations in the solid-state characteristics of anhydrous lactose and the subsequent impact of these differences on functionality [5]. The intra-vendor variability was generally low, although some batch-to-batch variation was observed. Not all of the measured inter- and intra-vendor variations in powder properties were observed to have a significant impact on the compression/compaction characteristics [5]. Albers et al. examined three lots of MCC type 101 from five different manufacturers for a total of 15 batches. The 15 batches showed different tableting behavior, and Analysis of Variance confirmed that the variation between different manufacturers and different batches of one manufacturer were statistically significant [6]. Studies done by Doelker et al. and Williams et al. examined the impact of different MCC suppliers and within-grade, lot-to-lot variability on tableting properties. It was found that variations exist between different sources and sometimes between lots from the same suppliers [7, 8]. Those variations had a significant impact on tableting indices or tablet product properties. These are just a few of the many reports highlighting the fact that excipient variability is inevitable and its influence on product quality needs to be accounted for.
In addition, unknown variations in excipient physical properties are responsible for many of the manufacturing problems that emerge unpredictably throughout the life cycle of a drug product. These problems result in costly rework, lot rejections, and quality investigations for the manufacturer and make it difficult for regulators to have meaningful regulations based upon science. Assessing the risk of this intrinsic excipient variation is very difficult because the principles that govern how excipient material properties influence the critical quality attributes of a finished dosage form are not well understood, and mixture rules for predicting the properties of excipient combinations are even less well understood. Consequently, this knowledge gap can lead to over-specification and arbitrary regulation in an effort to control all the sources of variation, but our lack of understanding still leaves the patient and manufacturer vulnerable to therapeutic and production failures.
As a result of this lack of information and understanding, today’s formulation scientist faces a knowledge gap when attempting to design pharmaceutical products and manufacturing processes. To address these issues, formulation scientists are devoting more effort into the evaluation of excipient properties and variation in these properties. One insightful approach to deal with excipient variability is based on the quantitative certificate of analysis [9]. Principal Component Analysis (PCA) was used to assess the amount of excipient lot-to-lot variability sampled during the development of new drug products to determine how much within grade lot-to-lot variability is present in three common excipients – microcrystalline cellulose (MCC), spray-dried lactose (SDL), and MgSt. They also examined the impact of excipient material property variability on drug product quality attributes of a roller compacted, immediate release tablet. Variations in the particle size of MCC and SDL led to significant changes in blend flow functional coefficient values, and granulation particle sizes. Furthermore, ribbon tensile strength and tablet hardness significantly increased as the particle size of MCC and SDL, and specific surface area of MgSt decreased [10]. Muteki et al. applied latent variable modeling to reduce the impact of raw material variability on the drug product quality [11]. For these studies, having access to a uniform and reliable material property database is essential to the analysis method. Some other approaches for incorporating excipient variability into the Design of Experiments (DoE) and the establishment of a design space are discussed by Moreton and Carlin [12, 13].
One approach for dealing with excipient properties is to catalog fundamental excipient properties (e.g., the set of potential critical quality attributes) and the variation in the properties in a web-based database. Physical property databases for various material classes are common in other fields of engineering; for example, there are many databases of material properties on the NIST website (http://www.nist. gov/data/materials.htm). These standardized and reliable material properties are indispensable to an engineer who is designing an industrial product and process. Currently, there are no such databases for the physical properties of pharmaceutical excipients.
The ultimate goal of this project is to establish an information system that is used to maintain values of fundamental pharmaceutical excipient material properties, and which contains models, best practices, and methods for using this data in the systematic design of pharmaceutical products and processes. This system will be publicly accessible in order to improve the efficacy, quality, and efficiency of manufacturers’ products. Thus, it is our hope that this study will provide useful information, serve as a basis for future studies, and hopefully generate industry wide interest in understanding the role excipients play in pharmaceutical manufacturing processes.
Materials and Methods
Given the large number of materials and methods, currently in the database, the reader is referred to the pharmaHUB website, which describes them in detail [14].
Data Sources
The data for the database were collected either via a comprehensive literature search or by measurements performed in the authors’ laboratories. For the literature data, the main sources were peer-review publications, and in some cases manufacturers’ certificates of analysis. For data collected by the authors, wherever possible, standardized methods such as USP or ASTM methods were used with full recording of experimental details, e.g., instrument models, test parameters and environment conditions. For measured parameters, typically, one laboratory collected all of one data type: Hoag’s laboratory at the University of Maryland collected the near infrared spectra, moisture content (loss on drying), specific surface area, particle size distribution (PSD using sieve analysis) and pycnometric density; Wassgren’s laboratory at Purdue University collected the particle properties (PSD using laser diffraction, apparent density), powder properties (poured and tapped bulk density, shear cell flow-related information) and compact properties (e.g., elastic modulus, tensile strength, critical stress intensity factor). Some properties such as bulk density, tapped density and flowability were measured at both laboratories for the purpose of assessment of variations among various instruments, locations, and personnel.
Database Hosting Infrastructure
The database is built upon the open source HUBzero® Platform [15]. HUBzero was developed at Purdue University and grew out of the NSFfunded Network for Computational Nanotechnology (NCN) project to support the website at nanoHUB.org [16, 17]. Currently, there are more than 30 “science gateway” websites powered by HUBzero, covering a wide range of scientific disciplines, including cancer care, pharmaceutical engineering, bio-fuels, earthquake engineering, volcanic activity, environmental modeling and engineering education. HUBzero infrastructure helps researchers create and publish interactive simulation tools, along with seminars, tutorials, teaching materials and other supporting resources; all of which can be accessed via an ordinary web browser. New computational tools can be quickly constructed using HUBzero’s Rappture toolkit. For example, it is relatively easy to create and run MATLAB code on the HUBzero platform. The use of HUBzero platform provides substantial built-in functionality.
To make the database truly useful, we need to go beyond just uploading data files; users must be able to easily explore (data mine), visualize data and use analysis tools to discover useful information from the datasets. The HUBzero architecture is ideally suited for these tasks because of its easy-to-use built-in functionality for uploading, managing data as well as creating and running analysis tools. These features are especially important for excipient users whose focus is not on managing complex computer services. In addition when exploring and analyzing data, we want to leverage these tools to create a user community and capture the knowledge and experiences of excipient suppliers and users. Such a platform creates a distributed environment for data and predictive software tools that can engage and link the excipient user community. In addition to the data and analysis tools, researchers can share information and support one another via social networking features, including question and answer forums, a wish list for potential improvements, wiki style documentation for database usage, a rating system for data quality, and web analytics to track the usage of data. To facilitate academic use of the database, each dataset and analysis tool will be managed through an online publication system and assigned a unique digital object identifi er (DOI) that can be referenced in academic literature. The resources available on nanoHUB.org are designed to support both education and research [18].
The excipient database is running on pharmaHub which is part of the HUBzero platform. The database can be found at the http://pharmahub.org/ web address [14]. The goal of pharmaHUB, which has been online since December 2007, is to share information and modeling tools that can support innovations in pharmaceutical product and process development.
Results and Discussion
To fully develop a comprehensive up-to-date database would be a monumental effort; to make the development process manageable we have broken the development down into a series of smaller steps that will produce a usable database, albeit incomplete, at the end of each step. The first step is to create the database infrastructure, and once the basic database infrastructure has been created, then it can be extended. For this first step, we focused on direct compression excipients, as they are very important and there is considerable data readily available. In the future, we will expand the range of excipients and dosage form types.
Database Structure
Figure 1 shows an overview of the database components, the user interfaces and the relationship with user workflow. From the web interface select, users can create and access web-forms for the contribution of data into the database. In addition, bulk data can be uploaded from files such as an Excel® file. Users can query the database and view the data in a variety of windows that facilitate exploring the data. These features are discussed in more detail in the following paragraphs.
 Figure 1. Schematic of database components and user interfaces.
In terms of the actual data organization within the database, the database structure is shown in Figure 2. At the lowest level are the database catalogs that specify the data elements and the relationships between the data elements. PharmaHub uses MySQL to define and manage the data elements (entities) and their relationships. At the 2nd level are the measurements, which are comprised of the raw data and associated measurement information. Building upon the raw data at the 3rd level are the derived data calculated from the raw data and the data displays. For example, a Hausner ratio is calculated from the bulk and tapped densities, which are the fundamental measurements stored in the database. Also, at this level are the data displays derived from the raw data. For example, the raw data for particle size is stored as a table of the fraction of a distribution in one column and the corresponding particle size range in another column, and this frequency distribution can be displayed graphically using the web interface. Select examples of these exploration capabilities currently available in the database include:
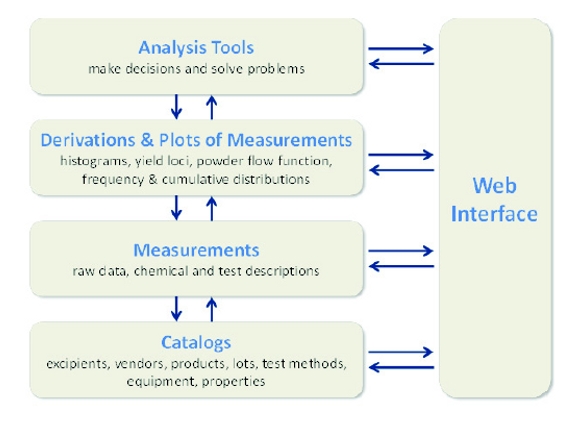 Figure 2. Basic database structure or the excipient database.
- Plots of near-infrared (NIR), Raman or infrared spectra that can overlay different spectra to explore property variations between vendors, between lots and even within lots
- Range searches on Hausner ratio and Carr compressibility index to identify flowability
- Calculate the powder flow function from shear cell data
- Evaluate and compare tablet tensile strength based on moisture content
- Explore particle size and particle size distribution data so that vendor-to-vendor and lot-to-lot variability can be assessed.
At the 4th level are the software analysis tools that can access the database and be used to explore (data mine), compare data and make predictions. This level is currently in the early stages of development. In addition, there are many useful educational materials available on pharmaHub.org, which are free for the reader to explore. Examples of software tools and presentations include:
- Powder flow data for a range of multicomponent mixtures
- Particle size distributions within a blend or granulate represented via histograms
- Granulation technology
- Time profiles of loss of potency and impurity formation for candidate formulations
- Pharmacokinetic data, including drug concentration in blood plasma and drug amount excreted in urine
- NIR spectra for prediction of compact density, moisture content, or crystallinity
Data Organization
The basic unit of the database is a sample property measurement, such as the particle size of a particular lot of a particular microcrystalline cellulose product. For this information to be useful, a lot of associated information must be linked to the sample measurement so that valid comparisons can be made. Figure 3 shows a schematic of a measurement and its associated information. For each sample measurement, there are two classes of information, the sample’s origins and the experimental conditions. To facilitate data mining and database searching the sample’s origins are categorized in a Linnaeus style hierarchical scheme, see Figure 3. At the highest level is the excipient class, which generally follows the USP-NF categorical designations. For example, the USP-NF defines microcrystalline cellulose as:
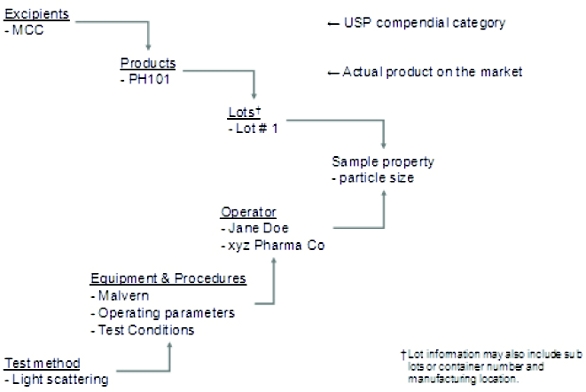 Figure 3. Excipient database structure, showing the associated information included with each measurement.
“Microcrystalline Cellulose is purified, partially depolymerized cellulose prepared by treating alpha cellulose, obtained as a pulp from fibrous plant material, with mineral acids.”
Thus, anything that fits this description is classified as MCC; however, this classification system cannot always be applied. For instance, some processed excipient grades contain mixtures of NF excipients, while some commercially available grades of lactose are granulated and contain a mixture of anhydrous and monohydrate crystalline forms, which have different NF monographs. In these instances we either categorize the material under the predominant excipient and include both CAS numbers or we gave it a separate designation such as coprocessed lactose, and mentioned the mixed composition in the description.
The next classification is the product, which contains products that fall within a particular NF definition. For example, Avicel PH101, PH102 and PH200 can be categorized as products that conform to the MCC NF monograph. To facilitate the characterization of product excipient variability, the next level is the product lot number. The lot number is more complex than it first appears because for excipients made by continuous processing, a lot can encompass all of the production done from a day to over a week. Thus, you also need to have sub lot or container numbers to characterize the intra-lot variability. In addition, the lot number may need to contain information about the manufacturing site for excipients made at multiple locations.
On the other branch is the information associated with the sample measurement technique. Specifically, the test procedure, equipment type, equipment settings, software version if applicable, sample preparation procedures, test environmental conditions, and name and affiliation of the individual performing the test are recorded. In addition, different property measurements can have different types of data that need to be recorded. For example, the bulk density is a single number while for particle size, the data is a set of numbers describing the particle size frequency distribution, and from these different data types the derived parameters can be calculated.
Database Features and Navigation
Web portal and Launching page
At this point in the article, the authors suggest that readers navigate the database. The database can be accessed by visitors worldwide via the pharmaHUB web portal (www.pharmahub.org), or they can go directly to the database which can be found at http://pharmahub.org/resources/458 [14]. This opening portal web page is the gateway by which users can enter the Excipients Knowledge Base at pharmaHUB. In addition, on this page there is a brief description of the Excipient Knowledge Base, project team, slide presentations with detailed descriptions of the data, database navigation and the project vision.
From the initial web portal page, the “View Link (HTML)” button gives users access to the “launching page” where users access the database to explore catalogs and measurements or to contribute new data, see Figure 4. While any visitor to pharmaHUB can explore the data through the data viewers, data contribution is restricted to approved users. However, registered database users are able to send feedback to the database development team for suggestions on how to modify the database, add additional information or correct errors found in the database. The launching page is divided into three sections. The first section lists the material and measurement catalogs, by which users can search, sort and compare materials based upon material class, i.e., excipients, products, vendor, lot and test method catalogs. The next section is the Property Measurements section, where one can examine a property and sort by the material properties. Finally there is the Product Reference Data, which contains data obtained from the peerreview literature and information supplied in manufacturers’ open literature on their products.
 Figure 4. Excipient database portal “launching page” from which the database can be accessed.
Data Viewer and Navigation Tools
The elements of the database are connected/displayed by the data viewer. For example, Figure 5 shows the Excipients Catalog “data viewer”. The data viewer interface provides the basic navigation tools by which users can search, sort, download and filter data in the database. The navigation tools are consistent with Windows® commands, and can be used by anyone with basic computer skills. As mentioned previously, these features are described in detail on the Launching Page. As illustrated in Figures 5 and 6, for most of the features, if one performs a mouse-hover or mouseover, a dialog box pops that provides a description of the feature. Information can be easily exported in bulk from the data viewer as a spreadsheet (CSV format file), and all the search, sort and filter actions will be reflected in the exported data (i.e., the data in the CSV file will be sorted and filtered in the same way as it appears in the data viewer, see Figure 6). In addition, individual text components of the database can be downloaded using the “copy and paste” commands. Also, when files are associated with an entity in the database, the file can be downloaded by clicking on the cell that is linked to the file.
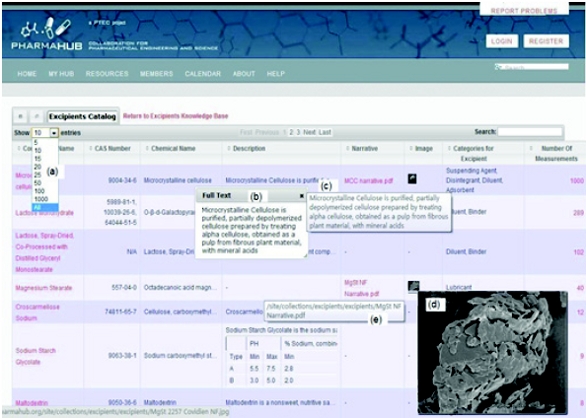 Figure 5. Excipient catalog and some navigation tools including (a) click to “show all”; (b) click for “cut and paste” display; (c) hover to view full description; (d) hover to see image thumbnail or click to view full image; (e) click for full narrative PDF description of the excipient class.
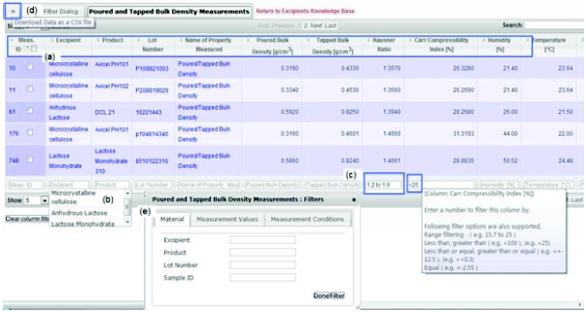 Figure 6. The search, sort, filter and download file from the database features are illustrated in: (a) data can be sorted for any column heading in the catalog either in ascending or descending order, e.g., sort on number of measurements to see how many measurements made for each product; (b) users can search data in any column using the column filters by selecting one of the entries or entering names or partial names; (c) users can search for numbers or number ranges by using =,> and/or< operators; (d) download web data to a spreadsheet; (e) fi lter using filter dialogue
Measurement Information Navigation
Obviously, any comparisons made using data collected by different test methods and conditions can be problematic and possibly lead to invalid conclusions. Thus, detailed documentation of the test methods and conditions is included with each measurement so that these differences can be taken into account, see Figure 3. One advantage of the database approach to catalog material properties is that the database can force users to enter all the experimental conditions into the database. When reviewing literature data, it is all too common to find critical experimental information missing from a publication. To explore these relations, the data viewer is used to navigate the links between a measurement and its test method. An example of how to find relevant experimental information for a Shear Cell Measurement is shown in Figure 7. Starting in the Excipients Catalog, the number of measurements in the database for each excipient is listed (see Figure 7a). By clicking on this number, a window appears showing all the property measurements associated with that excipient, and to see the experimental information associated with a Shear Cell Measurement, the user can click on the test method column (see Figure 7b), and another window pops up that lists the Test Method and Equipment used for that measurement. Clicking on either the Test Method or the Equipment entry (Figure 7c) gives a pop up menu that has the measurement information in Figure 7d. Note that the experimental information can also be accessed via the property measurement directly.
 Figure 7. Navigating the links between data elements and measurements: (a) total number of measurements associated with an excipient; (b) measurement summary; (c) test method data summary; (d) popup window with measurement description.
Computational Tools
One of the features with the greatest potential to improve formulation development is the ability to aggregate data and perform sophisticated computations on this data. Currently, these features are in the early stage of development. In addition to navigating and displaying data in a spreadsheet style format, the data viewer can be used to launch computational and visualization tools to help users mine the database. These tools include dynamic generation of charts and graphs, with support for different graph types (bar, line, scatter, etc.), see Figure 8. The graphs are created and updated according to the filtered and sorted data from the Data Viewer (e.g., column filters can be used to narrow down the list of records that are plotted when the “View Chart” button is clicked). The plotted data values can be displayed with related derived data in a spreadsheet below the graph; these data values can be sorted, searched and linked as in all data views. Figure 8 shows the calculation of the D10%, D50%, D90%, Sauter mean diameter, mass mean diameter and span using the raw particle size data in the database, as well as plots of the frequency and cumulative particle size distribution.
 Figure 8. Dynamic generation of graphs from the data in the data view, with support for diff erent graph types (bar, line, scatter, etc.) and statistical analysis methods.
Two or more material properties can be compared by going to the Product or any of the Property viewers and selecting the materials to be compared, see Figure 9a. As mentioned previously, one needs to be careful when making comparisons if the test conditions are not equivalent. Data can be plotted and statistical algorithms can be applied to the data before plotting. For example, database tools have been developed for mathematically preprocessing and plotting NIR spectra, see Figure 9b.
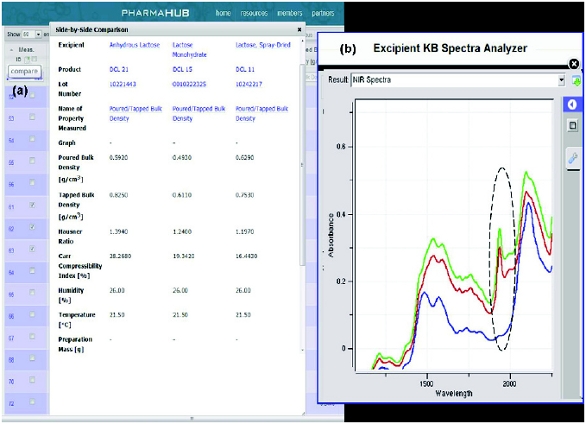 Figure 9. Comparisons of selected products (a) in a “side by side comparison” window – select the products to compare by clicking the product check boxes and then click on the compare icon and also (b) their NIR spectra (zoomed in view), note the monohydrate and anhydrous grades can be diff erentiated by the water peak around 1936 nm.
The structure of the database provides sufficient flexibility to link to pre-existing databases or simply import large datasets via spreadsheet format files. For example, microcrystalline cellulose is manufactured by controlled hydrolysis and spray drying in a continuous process. By real time tracking of the data during MCC manufacturing, the random variability in pH can be captured overtime and plotted in a histogram that shows the pH distribution during manufacturing, see Figure 10. Access to such in-process data will help formulators to understand the intrinsic variability in an excipient property, and give a more accurate assessment of the excipient manufacturing process and end-product variability.
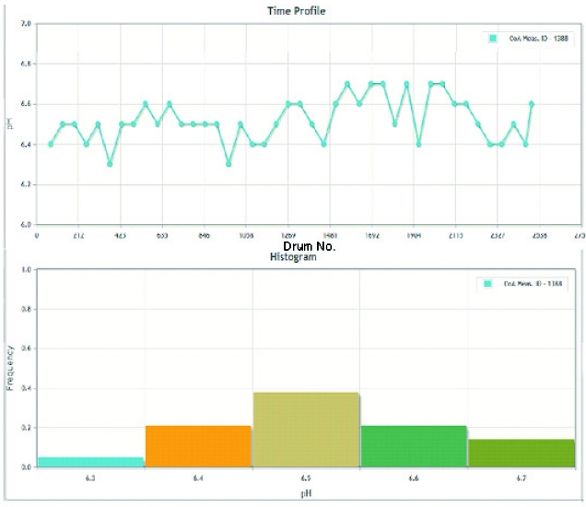 Figure 10. (a) Time profi le of pH values as a function of drum number; and (b) Distribution of the pH value of MCC during manufacturing.
Summary
The integration of the HUB environment and database technology offers the pharmaHUB community a powerful combination of data, tools, resources and collaborative services. By using the Excipient Database, users can explore, browse, search, sort, download, visualize and catalog data using fully documented experimental property measurements. The creation of an excipient database is the first part of a larger program to identify, measure, and provide useful models for predicting excipient properties that affect the performance of pharmaceutical dosage formulations; addressing these knowledge gaps should facilitate the ongoing industry and FDA initiatives that are focused on “Quality by Design.”
Acknowledgments
This project was funded by a joint project with NIPTE and FDA under Contract #HHSF223200910009C. The authors would also like to thank Bruno Hancock and Brian Carlin for their invaluable comments during development of the database.
References
- Guidance for industry, Q8 pharmaceutical development, Food and Drugs (Government Printing Office, Washington, DC). May 2006.
- H. Wu, M. Tawakkul, M. White, and M.A. Khan, Int. J. Pharm. 372(1-2), 39-48 (2009).
- J. Barra and R. Somma, Drug Dev. Ind. Pharm. 22(11), 1105-20 (1996).
- M. Hamad, A. Gupta, R. Shah, R. Lyon, V. Sayeed, and M. Khan, J. Pharm. Sci. 97(12), 5328-40 (2008).
- J. Gamble, W.S. Chiu, V. Gray, H. Toale, M. Tobyn, and Y. Wu, AAPS PharmSciTech. 11(4), 1552-7 (2010).
- J. Albers, K. Knop, and K. Peter, Pharmazeutische Industrie. 68(12), 1420-28 (2006).
- E. Doelker, D. Mordier, H. Iten, P. Humbert-Droz, Drug Dev. Ind. Pharm. 13(9-11), 1847- 75 (1987).
- R.O. Williams, M. Sriwongjanya, M.K. Barron, Drug Dev. Ind. Pharm. 23(7), 695- 704 (1997).
- J. Kushner IV, Pharm. Dev. Technol. Aug. 30, 1-10 (2011).
- J. Kushner IV, B.A. Langdon, J.I. Hiller, and G.T. Carlson, J. Pharm. Sci. 100(6), 2222-39 (2011).
- K. Muteki, V. Swaminathan, S. Sekulic, and G. Reid, AAPS PharmSciTech. 12(4), 1324-34 (2011).
- C. Moreton, American Pharmaceutical Review. 2009 March.
- B. Carlin and R.C. Moreton, Pharmaceutical Technology. 34, s36-s9 (2010).
- P.K. Basu, M.A. Khan, S.W. Hoag, C. Wassgren, A.C. Catlin, S.R. Fernando, et al. http:// pharmahub.org/resources/458.
- M. McLennan and R. Kennell, Computing in Science and Engineering. 12(2), 48-52 (2010).
- G. Klimeck, M. McLennan, S.P. Brophy, G.B. Adams III, M.S. Lundstrom, Computing in Science and Engineering. 10(5), 17-23 (2008).
- M.S. Lundstrom and G. Klimeck. Emerging Technologies – Nanoelectronics, IEEE Conference on. 496-500 (2006).
- G. Klimeck, G.B. Adams III, M.J. McLennan, M.S. Lundstrom. Eighth Annual Report, Volume I. Report No. 8, March 24 (2010).