Abstract
Proteins and peptides are widely used as biomarkers of disease state, as drug targets, and as biotherapeutics. Multiple MS approaches have been developed for the quantification of proteins, but often suffer from challenges such as extensive sample preparation, long chromatographic run times, and poor selectivity and/or sensitivity. We examined the use of high resolution, accurate mass experiments for the quantification of model proteins from plasma using a suitable isotopically labeled internal standard following overnight digestion with trypsin. Detailed discussions on the results and the benefits/limitations of high resolution, accurate mass experiments vs. nominal mass analyses are presented.
Introduction
The analysis of proteins and peptides as biomarkers of disease state [1-3], potential drug targets [4], and therapeutic drugs [1,5] has become increasingly important in the modern drug discovery process. To address this need, mass spectrometry has become the analytical method of choice due to its high sensitivity, selectivity, and specificity [6-7]. In particular, with the development of electrospray ionization (ESI) [8] and matrix assisted laser desorption/ionization (MALDI) [9] in the late 1980’s and subsequent advances in mass analyzers and multi-stage instruments, mass spectrometry is successfully able to address questions of increasing complexity.
Accurate quantification of proteins from a complex mixture is crucial for the investigation of protein biomarkers for pharmacodynamic (PD) studies and drug exposure measurements for pharmacokinetic (PK) studies on biologics. While the quantification of intact proteins has been reported [10-11], challenges such as ion suppression from coeluting species [12] and poor ionization of the target protein make intact protein quantification from complex mixtures largely impractical at this time [13]. A more commonly used technique for protein quantification involves measurement of a unique peptide(s) released in a stoichiometric ratio from the protein of interest following site-specific proteolysis [14-17]. A sample enrichment technique either before or after enzymatic cleavage, such as the use of protein depletion [18-19], immunocapture [20], and protein precipitation [21] is also typically employed in bioanalytical studies.
Triple quadrupole mass spectrometers operated in selected reaction monitoring (SRM) mode are typically the instruments of choice for quantitative analyses. In SRM experiments, a precursor ion is selected, fragmented, and a single fragment ion is chosen for detection. SRM experiments provide highly sensitive, precise, and accurate measurements due to fast duty cycles, often exhibit large dynamic ranges, and are frequently described in the literature for use in protein quantification [22-23]. However, because only a single parent/product ion pair is monitored and no mass spectra are acquired, SRM experiments provide little to no qualitative information.
More recently, the application of ion trap technology operated in SRM mode for the quantification of large peptides has been described [24]. The use of ion traps for protein analyses may be particularly beneficial due to their ability to generate full product ion MS/MS spectrum where all of the product ions arising from a single precursor ion may be acquired; similar experiments performed on a triple quadrupole MS typically result in large drops in sensitivity. Full product ion MS/MS spectra not only facilitate analyte identification, but can also be used for quantification by extracting unique product ions of interest from the total ion chromatogram (TIC) [25].
Finally, the application of full scan, high resolution accurate mass measurements (HRMS) for the quantification and characterization of proteins and peptides is an emerging methodology that is being applied to all areas of protein analyses [26]. An attractive benefit to the use of HRMS is that selection of a specific precursor ion is not required at the outset of an experiment since the instrument measures every analyte present in a sample within a given mass range. Consequently, researchers have the flexibility to mine full data sets at a later date. While this approach offers much more information from each sample, reports on applications of HRMS for protein and/or peptide quantification are still limited at this writing [27].
Table 1 - Summary of MS Experiments Performed

In the present study, we compared the use of different MS methods for the accurate and precise quantification of a model protein (horse skeletal apomyoglobin) spiked into a complex biological matrix (human plasma) at several concentrations. Samples were digested overnight with trypsin in the presence of a suitable, isotopically labeled internal standard peptide. Samples were analyzed by the following set of MS experiments (Table 1): (1) full scan, high resolution MS (HRMS) experiments performed on both Fourier transform ion cyclotron resonance (FTICR) [28] and orbitrap mass analyzers [29-30], (2) nominal mass, SRM experiments, and (3) nominal mass, full product ion MS/MS experiments – both of the nominal mass MS/MS experiments were performed on a linear ion trap (LIT) mass spectrometer [31]. This study will also describe several relatively simple sample preparation techniques that may enable higher-throughput quantification of proteins following proteolytic digestion.
Experimental Procedures
Materials
Horse skeletal apomyoglobin, trypsin (bovine pancreas), ammonium bicarbonate, formic acid, acetonitrile (LC/MS grade), and methanol (LC/MS grade) were obtained from commercial vendors. Pooled human plasma (anticoagulant – K3EDTA) was obtained from a commercial supplier. The isotopically labeled peptide used for quantification, H-VLIRLFTGHPET-[U-13C6,15N-Leu]-EKFDK-OH, was a custom synthesis prepared by a commercial supplier.
Instrumentation
Nominal mass LC/MS/MS experiments (SRM and full product ion MS/MS) were performed on a LIT mass spectrometer. HRMS experiments were performed on two different mass spectrometers, both coupled to a LIT, utilizing either FTICR or orbitrap technology as the mass analyzer. Each MS was interfaced to an ultra-high performance liquid chromatography (uHPLC) pump and an autosampler. Full scan accurate mass data was acquired at a resolution (Rs) of 25,000 (FTICR) or 30,000 (orbitrap) in positive ionization mode scanning from m/z 200 – 2000. Data was processed using vendor software specific for each mass spectrometer.
Sample Preparation
Human plasma (50 μL) was spiked with horse skeletal apomyoglobin (0, 0.0625, 0.125, 0.25, 0.5, 1.0, 2.0 nmol) and the isotopically labeled internal standard peptide (1 nmol) in the presence of 50 mM ammonium bicarbonate buffer pH 8.0 (N = 3 samples at each concentration). Samples were denatured at 90˚C for 20 min and then immediately crash cooled on ice for 10 min [32]. Trypsin was added (400 pmol) and samples were digested at 37˚C for 18 hr (100 μL total sample volume). The digestion was stopped by the addition of formic acid (final pH 2) and samples were diluted with water (100 μL) and methanol (200 μL) prior to LC/MS/MS analysis. Samples were maintained at 4˚C in the autosampler. The flow rate was set at 100 μL/min using mixtures of (A) water containing 0.1% formic acid and (B) acetonitrile containing 0.1% formic acid. Samples were injected (5 μL) and analytes were separated with the following gradient: hold at 0% B for 2 min, followed by a linear gradient to 30% B over 20 min, a subsequent column wash at 100% B for 2 minutes, and lastly a return to and hold at original starting conditions (0% B) for column re-equilibration (27 min total run time) with the uHPLC flow diverted to waste for the first 4 mins of the gradient. An uHPLC column, 2.1 x 100 mm, C18, BEH130, 1.7 μm particle size, heated to 40˚C was used for the analyses. Individual MS instrument parameters were optimized by infusing a peptide standard (2 mM) with a syringe pump into the MS source through a mixing tee at a flow rate of 5 μL/min with LC solvent (80:20 A:B solvents) flowing at 100 μL/min.
Results and Discussion
The goal of the present study was to compare and contrast the use of full scan, HRMS experiments using 2 different high resolution mass analyzers vs. more traditional, nominal mass MS/MS experiments (SRM and full product ion MS/MS) for the quantification of a model protein from a complex biological matrix. Samples were digested with trypsin and unique peptides from the model protein were measured by each of the aforementioned MS-based techniques. Each of the MS experiments was examined for sensitivity, accuracy, and precision based on the generation of standard curves using horse skeletal apomyoglobin spiked into human plasma at concentrations ranging from 0.0625 to 2.0 nmol.
Table 2 - Tryptic Peptides of Horse Skeletal (Apo)Myoglobin

The tryptic peptide chosen as the internal standard (T3-IS) in these experiments was T3 [32-42] (Table 2), labeled with a [U-13C6,15N-Leu] residue, resulting in a mass increase of +7 Da over the native peptide. The T3 tryptic peptide was selected as the internal standard because its sequence was not conserved in human apomyoglobin, it demonstrated high ionization efficiency/sensitivity, and it adhered to well-defined, recommended selection criteria for the design of suitable labeled peptides for quantification [21, 33]. The T3-IS was designed such that it contained ‘overhangs’ – additional amino acid residues mimicking the native sequence flanked both the N- and C-terminal ends of the final, desired sequence for the T3-IS, enabling researchers to assess recoveries throughout the entire workflow [23]. As these adjacent residues also contained tryptic cleavage sites, the desired isotopically labeled T3-IS was released following digestion with trypsin. Multiple tryptic peptides of apomyoglobin were quantified using the T3-IS (T1, T2, T3, T10, and T17); the ability to quantify multiple peptides of diverse sequences, charge states, and chromatographic retention times using a single, isotopically labeled internal standard is extremely desirable in protein analyses, where the design and synthesis of multiple labeled peptides is prohibitive.
For optimal sensitivity and reproducibility, complex samples are often enriched for the target protein of interest. For the experiments described here, no prior sample enrichment was performed and the horse skeletal apomyoglobin was digested directly in human plasma. Human plasma itself contains substantial amounts of endogenous proteins; therefore, a much larger amount of trypsin was required than what is typically recommended for the digestion of a purified protein to ensure complete digestion of the target protein. However, the elimination of a sample enrichment step prior to trypsin digestion is much more amenable to higher-throughput applications and speeds up analysis time in the discovery environment.
Horse skeletal apomyoglobin does not contain any cysteine residues, precluding the need for reduction and alkylation steps prior to enzymatic digestion; however, thermal denaturation of the samples was necessary for optimal digestion efficiency [32]. Samples were denatured prior to the addition of trypsin to prevent enzyme inactivation. Several commercially available surfactants marketed as chemical denaturants for use in proteolytic digests of proteins were also examined [34-35] and provided comparable results, but greater reproducibility was observed with thermal denaturation (results not shown) in addition to the added benefit of reduced costs for sample analyses.
Following sample acidification to stop the trypsin digestion, samples were diluted with methanol and water and directly injected for LC/MS(/MS) analysis without further sample preparation. The use of C18 tips to desalt the samples and protein precipitation with acetonitrile were examined, but greater reproducibility was observed with simple sample dilution (results not shown). The ability to analyze these samples from a complex mixture without the need for more rigorous sample preparation techniques is particularly advantageous as it obviates the possibility for sample losses that typically plague any sample preparation technique including desalting, protein precipitation, and solid-phase extraction (SPE). The associated analysis cost per sample is also reduced.
Chromatographic resolution between the target peptides of interest from any endogenous proteins was also helpful for accurate quantification. Electing to monitor only tryptic peptides unique to horse skeletal apomyoglobin provides some specificity in the SRM scan mode as well as using high resolution in the full scan experiments, but other co-eluting species could result in ion suppression of the peptides of interest and possibly negatively affect the sensitivity of the MS analyses. The use of uHPLC and small particle sized columns dramatically reduces the chromatographic run times necessary to achieve adequate analyte separation relative to traditional HPLC.
Data Processing
For quantification purposes, data from each experiment was generated according to the following:
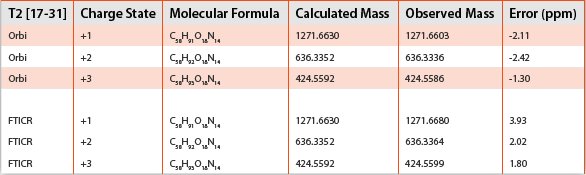
- Full scan, HRMS (FTICR and orbitrap) – the +1, +2, and +3 charge states for each tryptic peptide monitored (except for the +1 charge state of the T2 peptide on the FTICR, which was not observed) were extracted from the total ion current (TIC) and the peak areas summed for quantification.
- SRM – Precursor ion selection – the charge state that demonstrated the greatest sensitivity in full scan, MS experiments for each peptide Product ion selection – the corresponding fragment ion with the highest relative abundance determined from the full product ion MS/MS experiments.
- MS/MS (full product ion) – product ions that were consistently observed at ≥ 30% relative abundance were extracted from the TIC and the peak areas summed for quantification.
Accuracy
There were two separate accuracy assessments performed on the MS results obtained in these studies: the mass accuracy of the full scan HRMS data and the accuracy of the calculated concentration obtained in the standard curve results for each sample monitored by the four different MS experiments.
It is common for peptides to exhibit multiple charge states in ESI and the use of full scan experiments enabled accurate mass measurements to be made on multiple charge states of the same peptide, providing even further qualitative confirmation. In addition, the peak areas corresponding to the masses for these multiple charge states can be summed for improved sensitivity in quantification. We examined the accurate mass results from the +1, +2, and +3 charge states for 6 peptides (tryptic peptides T1, T2, T3, T10, and T17, and the isotopically labeled peptide T3-IS); results were obtained on both FTICR and orbitrap mass analyzers. A resolution of 25,000 and 30,000 were used for the FTICR and the orbitrap experiments, respectively.
Both mass analyzers provided results for each ion and charge state detected that were within the generally accepted mass accuracy tolerance of ± 5 ppm of the calculated mass (to at least 4 digits past the decimal point); however, minor differences in the performance of each instrument were observed. The +1 charge state of the T2 peptide was not observed on the FTICR, but was with the orbitrap; however, this discrepancy can most likely be attributed to the reduced sensitivity observed with the FTICR relative to the orbitrap. While both mass analyzers investigated provided accurate mass measurements within accepted tolerance limits and are suitable for use in both quantitative and qualitative assessments, the overall mass error observed with the orbitrap-generated results was lower than with the FTICR for just over half of the total ions measured. A comparison of the accurate mass measurements obtained for the T3 peptide on both orbitrap and FTICR mass analyzers is shown in Table 3.
Table 3 - T3 Peptide – HRMS Measurements
In the accuracy evaluation of the calculated concentrations for each standard curve concentration (0, 0.0625, 0.125, 0.25, 0.5, 1.0, 2.0 nmol apomyoglobin), the results for all 4 of the different MS experiments performed must be compared. Standard acceptance criteria for LC/MS/MS bioanalytical analyses typically require accuracy and precision results to be within ±15%, except at the lower limit of quantification (LLOQ) when ±20% is acceptable, and these criteria were used in the review of the data presented here. The accuracy of the full scan, HRMS data obtained on the orbitrap was moderately improved than the same type of data generated on the FTICR – using the orbitrap mass analyzer, 4 out of 5 peptides were within acceptable accuracy tolerances compared with only 3 of the 5 peptides on the FTICR. The accuracy tolerances for the remaining peptides did not exceed ±30% from expected (averaged values), which may still be acceptable depending on the specific assay and results requirements (e.g., absolute vs. relative quantification; discovery vs. clinical). The results for the nominal mass MS/MS experiments (SRM and full product ion MS/MS) were fairly comparable to each other; in each set of experiments only one peptide (out of 5 total) failed to meet the ±15% acceptance criteria and that single peptide did meet a ±20% accuracy tolerance, which is probably sufficient for most assay requirements. These results demonstrate that the use of full scan, HRMS experiments, using either the FTICR or the orbitrap, are comparable to both SRM and full product ion MS/MS nominal mass experiments with respect to accuracy and that any of these experiments can be used to generate highly accurate results.
Precision
Samples were prepared in triplicate at each standard curve concentration to assess the reproducibility of the sample digestion, sample preparation, and MS analyses. Again, the recommended FDA guideline of ±15% relative standard deviation (RSD) for a bioanalytical assay was followed in the results evaluation. Each of the instruments and MS experiments investigated provided approximately equivalent results.
At the lowest standard curve concentration(s), several of the peptides suffered from >15% RSDs in all four of the MS experiments evaluated; however, there was no consistency in which peptides failed to meet the acceptance criteria amongst the different MS experiments. Reduced precision (as well as accuracy) at lower analyte concentration(s) is not uncommon in a bioanalytical assay and wider tolerances in the acceptance criteria may be warranted. At the higher standard curve concentrations, all 5 tryptic peptides monitored by each of the 4 different MS experiments did meet the ±15% performance criteria.
Another measure of precision in the calibration curve results is the R2 variable, or coefficient of determination, which is used as a measure of the goodness of fit for a particular model. Calibration curves and linear regression values were generated for each tryptic peptide monitored and for each MS experiment performed; the generally accepted criteria of an R2 value ≥ 0.99 was used to summarize these results. The orbitrap mass analyzer generated superior data operated in the full scan, HRMS mode with all five of the tryptic peptides showing excellent correlations (R2 values ≥0.99). However, none of the calibration curves generated from the full scan, HRMS results obtained with the FTICR mass analyzer gave R2 values ≥0.99; all were between 0.972–0.988, which may still be acceptable depending on the needs of the specific data or assay. The results from both nominal mass MS/MS experiments were comparable providing R2 values ≥0.99 for 2 out of 5 tryptic peptides and R2 values for the remaining 3 peptides ranging from 0.978 to 0.988, which again are most likely sufficient for the majority of assays and applications. In addition, it can be expected that lower R2 values may be observed the peptides other than T3, where the IS peptide used was not an exact analogue for the measured peptide. Comparisons of the calibration curves and R2 values obtained for two different peptides, T3 and T17, generated by all 4 MS experiments, are shown in Figures 1 and 2, respectively.

Figure 1 - A comparison of the calibration curves and R2 values generated for the T3 tryptic peptide of horse skeletal apomyoglobin in human plasma using different MS experiments. (A) Full scan HRMS experiments using an orbitrap mass analyzer, (B) Full scan HRMS experiments using a FTICR mass analyzer, (C) SRM experiments (nominal mass), and (D) Full product ion MS/MS experiments (nominal mass).
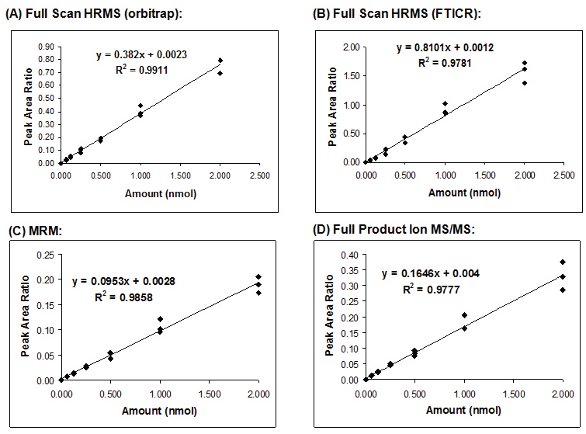
Figure 2 - A comparison of the calibration curves and R2 values generated for the T17 tryptic peptide of horse skeletal apomyoglobin in human plasma using different MS experiments. (A): Full scan HRMS experiments using an orbitrap mass analyzer, (B) Full scan HRMS experiments using a FTICR mass analyzer, (C) SRM experiments (nominal mass), and (D) Full product ion MS/MS experiments (nominal mass).
Sensitivity
Sensitivity comparisons were made by determining and comparing the estimated LLOQ. The full scan, HRMS experiments performed with the orbitrap mass analyzer provided results with the best overall sensitivity for the majority of the tryptic peptides, followed by the nominal MS/MS experiments (both SRM and full product ion MS/MS) that were comparable to each other. The full scan, HRMS experiments with the FTICR mass analyzer were the least sensitive with estimated LLOQ’s approximately 10x lower than those obtained on the orbitrap for the majority of the peptides. Representative chromatograms of the T3 peptide spiked with 0, 0.0625 (the lowest standard curve concentration; this is the estimated LLOQ on the FTICR and is ≥ 10x the estimated LLOQ on the orbitrap), and 2 nmol of horse skeletal apomyoglobin (the highest standard curve concentration) obtained using the orbitrap (left) and the FTICR (right) mass analyzers are shown in Figure 3. While it should be noted that sensitivity may be peptide specific, the results do demonstrate that good sensitivity can be achieved by several different MS experiments.

Figure 3 - Extracted ion chromatograms of the T3 tryptic peptide from horse skeletal apomyoglobin spiked into human plasma at different concentrations and digested overnight with trypsin (Left: results obtained on an orbitrap mass analyzer; Right: results obtained on a FTICR mass analyzer). (A) blank digest (0 nmol apomyoglobin), (B) 0.0625 nmol apomyoglobin (lowest standard curve concentration analyzed), (C) 2 nmol apomyoglobin (highest standard curve concentration analyzed)
Conclusions
Our goal was to compare and contrast the different MS techniques with respect to accuracy, precision, and sensitivity in protein quantification, providing researchers with beneficial analytical insight for application in their own studies within this rapidly growing field of research.
Table 4 - Results Summary of MS Experiments Performed
(+, ++, +++ indicate low, moderate, or high, respectively)

We described the use of and compared the results obtained from full scan, high resolution experiments using two different mass analyzers (orbitrap and FTICR) with more traditional, nominal mass MS/MS experiments, both SRM and full product ion MS/MS – a summary of these results is provided in Table 4. The results clearly demonstrate the utility of full scan, high resolution experiments for accurate, sensitive, precise, and selective protein quantification, as well as the additional benefit of qualitative peptide confirmation with the orbitrap mass analyzer slightly outperforming the FTICR with respect to accuracy, sensitivity, and precision – and in some instances outperforming the nominal MS/MS experiments as well. Since full scan data is acquired in HRMS experiments, there is no need for optimization of the MS/MS experimental parameters and data is obtained on both the known peptides of interest as well as other analytes present in the sample that may also provide useful information. In addition, no sample enrichment or sample clean-up before or after proteolytic digestion may enable more high-throughput applications.
Depending on the matrix type, the protein of interest and more specifically the unique peptide selected for measurement, and the particular issue under investigation, it may vary as to whether HRMS or nominal MS/MS experiments provide superior data or if multiple MS experiments may be needed. The results clearly demonstrate, however, that the use of full scan, HRMS experiments, in particular using the orbitrap mass analyzer, can be used to provide accurate and precise quantitative results for proteins in a biological matrix providing researchers with a powerful tool in the growing arsenal of MS-based approaches for the analysis of proteins from a complex biological matrix.
Acknowledgements
The author would like to thank Dr. Guodong Chen, Dr. Mark Sanders, Dr. Dieter Drexler, and Dr. Mohammed Jemal for their insightful discussions. Mr. David Wang-Iverson, Dr. Guodong Chen, Dr. Anne Aubry, and Dr. Adrienne Tymiak are thanked for their constructive review of this manuscript.
References
- John, H., Walden, M., Schäfer, S., Genz, S., Forssmann, W.-G. “Analytical Procedures for the Quantification of Peptides in Pharmaceutical Research by Liquid-Chromatography-Mass Spectrometry.” Anal. Bioanal. Chem. 2004, 378(4), 883-897.
- Tamvakopoulos, C. “Mass Spectrometry for the Quantification of Bioactive Peptides.” Mass Spectrom. Rev. 2007, 26(3), 389-402.
- Doherty, M.K., Beynon, R.J., Whitfield, P.D. “Proteomics and Naturally Occurring Animal Diseases: Opportunities for Animal and Human Medicine.” Proteomics Clin. Appl. 2008, 2(2), 135–141.
- Klase, Z.A., Van Duyne, R., Kashanchi, F. “Identification of Potential Drug Targets Using Genomics and Proteomics: A Systems Approach.” Advances in Pharmacol. 2008, 56, 327-368.
- John, H. “Liquid Chromatography-Mass Spectrometry in Peptide Drug Discovery and Development.” Anal. Bioanal. Chem. 2005, 371(1), 51-53.
- Koomen, J., Hawke, D., Kobayashi, R. “Developing an Understanding of Proteomics: An Introduction to Biological Mass Spectrometry.” Cancer Invest. 2005, 23(1), 47-59.
- Domon, B., Aebersold, R. “Mass Spectrometry and Protein Analysis.” Science 2006, 312(5771), 212 – 217.
- Fenn, J.B., Mann, M., Meng, C.K., Wong, S.F., Whitehouse, C.M. “Electrospray Ionization for Mass Spectrometry of Large Biomolecules.” Science 1989, 246(4926), 64-71.
- Karas, M., Hillenkamp, F. “Laser Desorption Ionization of Proteins with Molecular Masses Exceeding 10,000 Daltons.” Anal. Chem. 1988, 60(20), 2299-2301.
- Bunk, D.M., Welch, M.J. “Electrospray Ionization Mass Spectrometry for the Quantitation of Albumin in Human Serum.” J. Am. Soc. Mass Spectrom. 1997, 8(12), 1247-1254.
- Gordon, E.F., Mansoori, B.A., Carroll, C.F., Muddiman, D.C. “Hydropathic Influence on the Quantification of Equine Heart Cytochrome C Using Relative Ion Abundance Measurements by Electrospray Ionization Fourier Transform Ion Cyclotron Resonance Mass Spectrometry.” J. Mass Spectrom. 1999, 34(10), 1055-1062.
- King, R., Bonfiglio, R., Fernandez-Metzler, C., Miller-Stien, C., Olah, T. “Mechanistic Investigation of Ionization Suppression in Electrospray Ionization.” J. Am. Soc. Mass Spectrom. 2000, 11(11), 942-950.
- Barnidge, D.R., Goodmanson, M.K., Klee, G.G., Muddiman, D.C. “Absolute Quantification of the Model Biomarker Prostate-Specific Antigen in Serum by LC-MS/MS Using Protein Cleavage and Isotope Dilution Mass Spectrometry.” J. Proteome Res. 2004, 3(3), 644-652.
- Dass, C., Kusmierz, J.J., Desiderio, D.M. “Mass Spectrometric Detection of Endogenous β-Endorphin.” Biol. Mass Spectrom. 1991, 20(3), 130-138.
- Gerber, S.A., Rush, J., Stemman, O., Kirschner, M.W., Gygi, S.P. “Absolute Quantification of Proteins and Phosphoproteins from Cell Lysates by Tandem MS” Proc. Natl. Acad. Sci. USA. 2003, 100(12), 6940-6945.
- Mallick, P., Schirle, M., Chen, S.S., Flory, M.R., Lee, H., Martin, D., Ranish, J., Raught, B., Schmitt, R., Werner, T., Kuster, B., Aebersold, R. “Computational Prediction of Proteolytic Peptides for Quantitative Proteomics.” Nat. Biotechnol. 2007, 25(1), 125-131.
- Cantone, J.L., Xu-Lin, A., Toyn, J.H., Drexler, D. “Application of Quantitative LC-MS Surrogate Peptide Methodology in the Analysis of the Amyloid Beta Peptide (Aβ) Biosynthetic Intermediate Protein APP-βCTF.” J. Neurosci. Methods 2009, 180(2), 255-260.
- Tirumalai, R.S., Chan, K.C., Prieto, D.A., Issaq, H.J., Conrads, T.P., Veenstra, T.D. “Characterization of the Low Molecular Weight Human Serum Proteome.” Mol. Cell. Proteomics 2003, 2(10), 1096-1103.
- Björhall, K.; Miliotis, T., Davidsson, P. “Comparison of Different Depletion Strategies for Improved Resolution in Proteomic Analysis of Human Serum Samples.” Proteomics 2005, 5(1), 307-317.
- DuBois, M., Fenaille, F., Clement, G., Lechmann, M., Tabet, J.-C., Ezan, E., Becher, F. “Immunopurification and Mass Spectrometric Quantification of the Active Form of a Chimeric Therapeutic Antibody in Human Serum.” Anal. Chem. 2008, 80(5), 1737-1745.
- Wu, S.T.; Ouyang, Z.; Olah, T.V.; Jemal, M. “A Strategy for Liquid Chromatography/Tandem Mass Spectrometry Based Quantitation of Pegylated Protein Drugs in Plasma Using Plasma Protein Precipitation with Water-Miscible Organic Solvents and Subsequent Trypsin Digestion to Generate Surrogate Peptides for Detection.” Rapid Commun. Mass Spectrom. 2011, 25(2), 281-290.
- Anderson, L., Hunter, C.L. “Quantitative Mass Spectrometric Selected reaction monitoring Assays for Major Plasma Proteins.” Mol. Cell. Proteomics 2006, 5(4), 573-588.
- Barnidge, D.R., Hall, G.D., Stocker, J.L., Muddiman, D.C. “Evaluation of a Cleavable Stable Isotope Labeled Synthetic Peptide for the Absolute Protein Quantification Using LC-MS/MS.” J. Proteome Res. 2004, 3(3), 658-661.
- Shipkova, P., Drexler, D.M., Langish, R., Smalley, J., Salyan, M.E., Sanders, M. “Application of Ion Trap Technology to Liquid Chromatography/Mass Spectrometry Quantification of Large Peptides.” Rapid Commun. Mass Spectrom. 2008, 22(9), 1359-1366.
- Goodenough, A.K., Turesky, R.J. “A Novel LC/MSn Method for the Characterization and Quantification of 2’-Deoxyguanosine Adducts of the Dietary Carcinogen 2-Amino-1-methyl-6-phenylimidazo[4,5-b]pyridine by 2-D Linear Quadrupole Mass Spectrometry.” Chem. Res. Toxicol. 2007, 20(2), 263-276.
- Liu, T.; Belov, M.E., Jaitly, N., Qian, W-.J., Smith, R.D. “Accurate Mass Measurements in Proteomics.” Chem. Rev. 2007, 107(8), 3621-3653.
- Keire, D.A., Whitelegge, J.P.; Souda, P.; Faull, K.F., Bassilian, S., Reidelberger, R.D., Haver, A.C., Reeve, J.R. Jr. “PYY(1-36) is the Major Form of PYY in Rat Distal Small Intestine: Quantification Using High-Resolution Mass Spectrometry.” Regul. Pept. 2010, 165(2-3), 151-157.
- Marshall, A.G., Hendrickson, C.L., Jackson, G.S. “Fourier Transform Ion Cyclotron Resonance Mass Spectrometry: A Primer.” Mass Spectrom. Rev. 1998, 17(1), 1-35.
- Makarov, A. “Electrostatic Axially Harmonic Orbital Trapping: A High-Performance Technique of Mass Analysis.” Anal. Chem. 2000, 72(6), 1156-1162.
- Hu, Q., Noll, R.J., Li, H. Makarov, A., Hardman, M., Cooks, R.G. “The Orbitrap: A New Mass Spectrometer.” J. Mass Spectrom. 2005, 40(4), 430-443.
- Schwartz, J.C., Senko, M.W., Syka, J.E.P. “A Two-Dimensional Quadrupole Mass Ion Trap Mass Spectrometer.” J. Amer. Soc. Mass Spectrom. 2002, 13(6), 659-669.
- Park, Z-.Y., Russell, D.H. “Thermal Denaturation: A Useful Technique in Peptide Mass Mapping” Anal. Chem. 2000, 72(11), 2667-2670.
- Hagman, C.; Ricke, D.; Ewert, S.; Bek, S.; Falchetto, R.; Bitsch, F. “Absolute Quantification of Monoclonal Antibodies in Biofluids by Liquid Chromatography-Tandem Mass Spectrometry.” Anal. Chem. 2008, 80(4), 1290-1296.
- Yu, Y-.Q., Gilar, M., Lee, P.J., Bouvier, E.S.P., Gebler, J.C. “Enzyme-Friendly, Mass Spectrometry-Compatible Surfactant for In-Solution Enzymatic Digestion of Proteins.” Anal. Chem. 2003, 75(21), 6023-6028.
- Duan, X., Young, R., Straubinger, R.M., Page, B., Cao, J., Wang, H., Yu, H., Canty, J.M. Jr., Qu, J. “A Straightforward and Highly Efficient Precipitation/On-Pellet Digestion Procedure Coupled to Long Gradient Nano-LC Separation and Oribtrap Mass Spectrometry for the Label-Free Expression Profiling of Swine Heart Mitochondrial Proteome.” J. Proteome Res. 2009, 8(6), 2838–2850.
Author Biography
Dr. Angela K. Goodenough is currently a Research Investigator II at Bristol-Myers Squibb, Princeton, NJ. She specializes in the development of MS-based approaches for the characterization and quantification of small molecule biomarkers and large biomolecules (biologics and protein biomarkers). She earned her Ph.D. from Vanderbilt University.
This article was printed in the May/June 2011 issue of American Pharmaceutical Review - Volume 14, Issue 4. Copyright rests with the publisher. For more information about American Pharmaceutical Review and to read similar articles, visit www.americanpharmaceuticalreview.com and subscribe for free.