In a previous paper, we advocated a laboratory informatics solution comprised of simple, modular applications rather than currently available “big box” solutions; several examples of efficient and novel capabilities were provided [1]. Two themes arose. First, limited-scope, modular applications like those commonly used with personal computing devices make software easier to use. Second, facile extensibility of existing software is required to address unanticipated needs. The content of [1] focused largely on defining what the challenges of usability and extensibility actually are and what analytical laboratories need. This paper focuses on how laboratories might get there, how laboratory software can follow personal computing capabilities by months, not years or decades. The picture presented is a holistic one, not relegated to the domain of only a chromatography data system or only an electronic notebook or only a laboratory information management system: it is a foundation that can be used by all of these products as well as for new unforeseen application solutions. The specific architecture described is not dogmatic; it is but one solution, not necessarily the only solution. The principle, however, is stated axiomatically: analytical laboratories must adapt to unanticipated needs using data-driven software solutions.
Despite advances in automation and instrumentation, it is inevitable that customers encounter problems that the vendors have not provided for. Examples include validation of text input against local business rules (e.g., project codes, lab notebook references) and vendor-neutral solutions. Such problems, although related to the analytical instrumentation, generally lie outside the purview of vendors, yet they are problems that customers need to resolve. This paper attempts to suggest an architecture that permits unobstructed, flexible data access, allowing customers to resolve some of their own problems. It is an immediate continuation of [1]; the two papers should be read together and the figures compared side-by-side. While the discussion has focused on chromatography and the pharmaceutical industry, the principles and architecture should be well suited to other market sectors.
Adaptability in Biology and Laboratory Informatics
The laboratory informatics solution described here has similarities to information flow in biological systems. To illustrate computer concepts for a broader audience, the architecture is discussed in comparison with various components in biological systems. While the analogy does not bolster the proposed architecture, it is hopefully instructive. Like most analogies, it holds well at a high level but it should not be taken too far.
Table 1- Similarities between biological and laboratory informatics systems in the architecture described here. The analogy is hopefully instructive for those less familiar with computer systems. The key point is that both systems can lead to an adaptable entity that can change to meet the needs of an ever-changing environment.
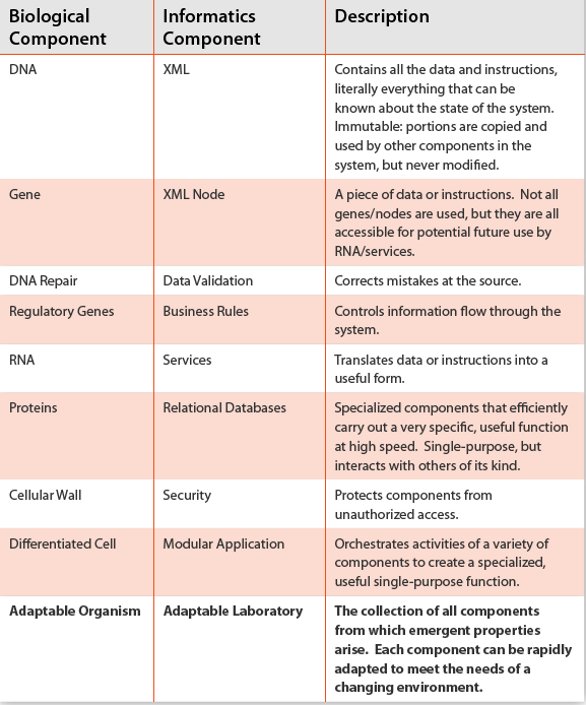
Biological systems are complex and information rich, far more so than our laboratory information systems. And yet biology works most of the time. Organisms are highly optimized for their environment and emergent properties arise ‘magically’ from information stored in DNA [2]. Laboratory informatics systems exhibit similar outcomes; powerful software and capabilities arise from files on disk or content stored in memory. Table 1 provides a list of hierarchical components that “build on each other” to comprise biological and informatics systems. The similarities lead to one conclusion: that of an adaptable organism or laboratory.

Figure 1- An adaptable architecture supports unanticipated and changing needs. Every time a modular application is opened (purple box), data is checked against a Business Rules & Templates Repository (BRTR). Valid data then flows through modular client applications into the Primary Data Store (PDS). Specialized services (orange) respond when new data arrives in the BRTR or PDS, extracting and placing only the necessary parts into specialized relational databases that provide organized content to various client applications. The BRTR and PDS employ a shared, public ontology; all other components are vendor-specific. SQL and XPath interfaces support ad hoc queries. Chromatography Data Systems, Electronic Notebooks, and Laboratory Information Systems are all subsets within this architecture.
A Holistic Approach to Laboratory Informatics
The overarching theme is that adaptability requires unprecedented access to the DNA of the laboratory. Throughout this paper, XML is cited as the document format of choice (the DNA of the lab). This is not prescriptive; other data-interchange formats like JSON (www.json. org) or open binary formats might be preferable in some situations. For brevity, however, XML is cited merely to illustrate the features and benefits of an open-document based solution. Figure 1 illustrates a holistic and adaptable computer architecture designed to meet all of the efficiencies and new capabilities described in [1] (e.g., point-andclick reports, modeling, optimizations) as well as new, unforeseen applications. At the highest conceptual level, the flow of information (data and instructions) starts from the bottom left corner of Figure 1. Upon opening any of the modular client applications, data is validated before entry into the system and then flows seamlessly through the entire system in a clockwise direction back to the client application. In all cases the flow of information is mediated by specialized services and relational databases.
In summary, data is protected and traceable, satisfying 21 CFR 11 requirements [3]; data is validated before entry into the system to support unprecedented data mining and downstream error prevention capabilities and the architecture is rapidly extensible to support development of new ad hoc solutions or productionquality applications. Closed, vendor-specific data formats are not precluded, but they are also not required because all data is stored in XML. Finally, data is easily accessible from client applications and, importantly, from outside these applications using either SQL or XPath queries. Examples follow, but first a more detailed description of the architecture.
A Universe of Possibilities: The Primary Data Store
The bottom right region of Figure 1, termed the Primary Data Store (PDS), contains all the laboratory data and instructions, literally everything that can be known about the system.
The XML documents in the PDS are immutable: once created they can never be changed. They document the state of every part of the system at a specific point in time. New XML documents can be created to supersede existing ones, but existing documents cannot be modified or replaced. The XML documents are produced by the modular application groups discussed in Figure 3 of [1] and represent sample metadata, analysis metadata, analytical methods, laboratory instrument instructions, raw instrument data, processed data, and reported data. Binary data (e.g., the raw signal) may be encoded in Base64 and stored as a text string in the XML document or for larger data sets the XML document might contain a reference to binary data stored in an open, accessible format to support high-speed access.
Each XML document is uniquely named with a system-generated human-readable file name. For example, the XML document representing processed data might be named as a concatenation of the unique instrument ID, a timestamp identifying the start of the data acquisition, and a timestamp representing the start of data processing. This represents an interpretable and unique file that can be quickly found by the services and its data extracted and used by other parts of the system. Other naming schemes are possible, but they must ensure a globally unique file name. As with DNA, not all XML nodes (genes) are useful for all parts of the system. However, each node is easily accessible to all other parts of the system. This facile accessibility is currently missing in today’s laboratory and it is the fundamental key to adaptability discussed in the examples below.
Invisible Helpers: Specialized Services
A service is an invisible software application that runs “in the background.” There are two kinds of services (orange box): the minority that interact directly with a client application (dashed line) and the majority (solid line) that monitor the creation of new XML documents on a secure file share and respond accordingly by safely extracting useful portions and placing them in a limited-scope relational database (blue box). This data translation requires a well-defined object-relational model that is more easily developed if the relational databases are kept manageably small and of limited scope. Keep it simple. The services themselves will vary in complexity depending on scope of the solution, but all of them will likely implement event-based monitoring and multiple threads to ensure adequate performance (e.g., filling the database nearly instantaneously upon arrival of the XML document into the PDS). Note that in addition to simply shuffling data through the system, these individual services can be licensed as distinct products and combined in numerous ways to form configurable workflows using a workflow management application.
Fast Data Access: Specialized Relational Databases
Fueled by the services that provide data from the PDS and BRTR, the relational database management system (RDBMS) provides fast access to all the data used by all applications. Two exceptions to this rule are high-performance applications where a service might provide content directly to the client from an in-memory cache, bypassing the RDBMS, or when “live” streaming data is required (dashed arrow in Figure 1). Each database stores all superseded records, but by default applications might expose only the currently valid data from the PDS and BRTR to prevent cluttering the work environment with invalid content (e.g., superseded instrument methods). Thus, audit trails and traceability are available upon special request but “old data” does not clutter the current working environment. In principle, a new database can be easily added, built from the primary data stored in the immutable XML documents stored in the PDS.
Keeping Data Safe: Security, Authentication, Authorization
Primary data in the XML documents are protected by the computer’s operating system. Information stored in the XML documents is accessible, but only by services and a select few individuals with appropriate authorization. Modern operating systems provide this level of security by authenticating (you are who you say you are) and authorizing (yes, you may have access) user access to content stored in the XML. Additionally, modern scalable frameworks like iRODS (Integrated Rule-Oriented Data System), used by the digital archiving, seismology, astronomy, and physics communities, offer powerful security for file-based collections using granular, policy-based rules that determine who can do what with a given file [4].
Poka Yoke – Getting it Right the First Time
Today’s vendor applications rarely provide sufficient validation of data entry. Manual, unchecked keyboard entry of text is ubiquitous and this means that databases are filled with incorrect data or 50 different correct ways to say the same thing; both scenarios result in nearly useless database queries. And this makes getting meaningful data from the RDBMS nearly impossible. Data validation is implemented here with a “poka yoke” (mistake proofing) mindset, a term borrowed from lean manufacturing in which errors are ideally corrected before they have a deleterious effect. The bottom left corner of Figure 1 depicts this feature implemented using the Business Rules & Templates Repository (BRTR).
Table 2- Business rules are enforced globally and immediately before data enters the system because each client application checks for updates to configurations, business rules, and templates every time the application is opened for use. This “poka yoke” error prevention and correction enables instant adoption of changes in business rules and SOPs across an entire organization.

Like data in the PDS, these individual XML documents are also immutable, but updateable with new unique and time-stamped versions to support traceability. Unlike the PDS, however, the XML documents in this validation section are singletons: one and only one document instance is valid at any given time and it is the “master” that client applications must consume and conform to every time the application is opened (although content could be mirrored across multiple computers). It effectively serves the role of a “benevolent dictator”, protecting the system from inadvertent mistakes, because only valid objects are presented to the user’s client for downstream entry into the PDS and relational databases. Structurally, this could be implemented as a dictionary containing key-value pairs. The values can be simple or complex depending on how many variables are needed to describe the object. For example, the values for an HPLC column might contain one and only one validated value for each of the following: vendor, model, part number (not serial number), length, diameter, particle size, stationary phase, and minimum and maximum values for pH and temperature. Validated values for these objects leads to extremely positive downstream affects: fast meaningful aggregation queries, intelligent error checking in the lab, instantaneous global adoption of business rules, and point-and-click report generation. Four control mechanisms exist in the BRTR and are summarized in Table 2.
Adaptability in Action: Examples from the Real World
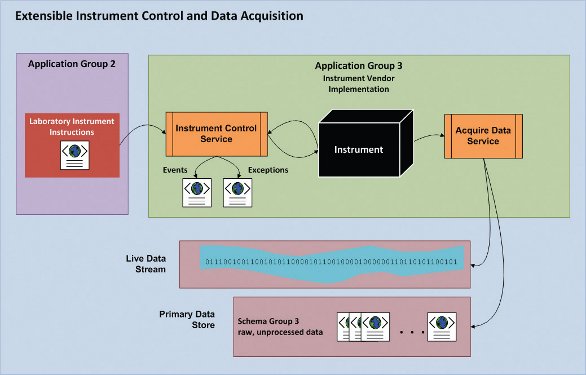
Figure 2- Specification-implementation model for laboratory instrument control and data acquisition. Instrument vendors implement instructions provided to the instrument control service by Application Group 2. Data is saved to the PDS as raw, unprocessed data for consumption by Application Group 4 (Data Processing, see [1] and Figure 1 above). Live data streaming from the instrument is provided as a decorated stream for client applications to display and respond to live data.
Instrument Control & Data Acquisition
Real-time, closed-loop automated control of laboratory instruments was described in [1]. These and other “intelligent” applications require a new level of instrument control. Figure 2 shows how this architecture can support rapid development of new experiments in the lab, where the instrument is treated as a “black box” that receives instructions from Application Group 2 [1] in the form of an XML document containing a sequence of instructions.
In this model, the primary job of the laboratory instrument is to execute instructions provided by the XML document, raise events to notify clients that something important has happened, and raise exceptions if something goes wrong so clients may handle errors appropriately. For example, if the instrument is an NMR, the instruction set might be sample metadata along with a series of shaped RF pulses, delays, and acquisitions combined to make a novel pulse sequence; for HPLC, one single instruction could be “turn on column heater and heat to 40 degrees C.” All of these instructions are mediated by the instrument-vendor’s instrument control service that reads the simple XML instructions and implements a max-priority queue [5] of sample sequences, bundled with the instrument instructions associated with each sample in the sequence.
All the complexity of instrument control is hidden and handled by the service. The idiom is, “Here’s the sample and it’s method information, go!” This approach amounts to a facade design pattern [6, 7] that simplifies today’s proprietary instrument drivers and is akin to a specificationimplementation model used for computer language compilers. Different analytical techniques will obviously require different instruction sets and vendor-specific hardware will require slight differences in instruction sets based on different hardware features or capabilities. However, all instructions should be defined at a level of abstraction to support adaptable work practices by analytical chemists, not software developers.
Data acquisition is handled by the instrument vendor’s service and has two distinct outputs. First, during data acquisition a typed (decorated) binary stream is accessible to enable reading of temporary, non-stored “live” data as it is generated from the instrument. Second, upon completion of data acquisition, the raw data produced by the instrument is written to the PDS in “Schema Group 3” (see Figure 1).
This level of instrument control and data acquisition allows for intelligent, live, interactive method development, optimization, and error correction on-the-fly, without the need for manual intervention. This automated closed loop of “control instrument – analyze data – control instrument” offers unprecedented opportunity to automate extremely timeconsuming manual activities (e.g., optimization) and it is easily supported using this approach.
Data Access – Concept
Two sources exist for ad hoc data access: the relational databases and the XML documents. This two-option data access model exploits the strengths and avoids the weaknesses of both XML and RDBMS as data storage mechanisms. For example, XML encapsulates everything there is to know about a single object – one sample, one sample sequence, one experiment, one instrument, etc. – in a single document. This gives rise to its primary strength – all the data that describes the object is accessible from one neat package and XML can be intuitively structured to access anything and everything from the single XML document. XML is also descriptive; it conveys meaning and is easily interpreted. So if you want to know everything about a few objects, simply use one of many available third-party tools to query the XML. However, XML is not ideal for working with extremely large collections of similar objects. Enter RDBMS, which organizes data in tables and provides superior data access to large collections of similar objects, spread across many different tables. The primary benefit of this organization is the ability to execute arbitrary and unforeseen queries across multiple objects in an efficient manner. The weakness of RDBMS, however, is that without clear documentation describing the database, it can be difficult or impossible for a nonspecialist to interpret, and therefore very difficult to actually create new queries. While the greater generality and efficiency associated with multiobject queries often tips the tables towards exclusive use of RDBMS, domains in which data needs are well understood, and which are primarily single-object based (as with many laboratory activities) can benefit from the usability of the document format. Furthermore, a document model offers a convenient way to aggregate data, e.g., from multiple vendors. If vendors each create a separate database, it can be technically challenging to query across these databases; a document-based aggregation, though it may be somewhat inefficient, is trivially achieved. In the examples that follow, this pattern of moving between RDBMS and XML data formats emerges as an extremely flexible solution to the adaptability challenge facing today’s laboratories.

Figure 3- Extensible data access using both relational databases and XML documents in the PDS. Unanticipated questions can be quickly answered using a SQL query against a relational database. Subsequent ad hoc answers then accumulate over time; those that rise in importance can be implemented as a stored procedure for fast data access. If the data does not exist in the database, the PDS is queried after which important queries then get supported by a new database.
Data Access – Example
It’s a common scenario. A manager or scientist asks a question that requires data spread across multiple systems or locations. Figure 3 illustrates a rapid workflow that can provide fast answers to unanticipated questions, based on using the SQL and XPath interfaces specified in Figure 1.
If the necessary data exists in the RDBMS, then an ad hoc query is executed and an ad hoc result set is produced to satisfy a one-off need, usually in a few minutes. Custom queries will proliferate and over time these read-only SQL queries will form a collection that can be monitored for frequency of use or relative importance. If necessary, a stored procedure is easily added to the RDBMS, thus enabling a generalized answer that can be executed in seconds.
The second possibility is that the required data is not stored in the database (the “No” path in Figure 3). In this case, the PDS provides the data. Individual XML documents on the file share can be iterated over by operating system services and needed information contained in each XML document can be extracted using an XPath query. This pattern supports both DOM and SAX models, optimized for either full-control or high-speed data access. The end-result is the same as if the data were stored in the RDBMS: an ad hoc result set is provided quickly. As with the RDBMS data access example, frequently requested XPath queries can be prioritized and implemented as a new data service, relational data table(s), or even a new database, each of which would be optimized to support the custom (but important) data access needs. To continue the biological analogy, introns (previously unused XML nodes) have become exons (useful XML nodes).
Point-and-Click Reports
Writing reports and documents manually is extremely time-consuming. This architecture supports the rapid development of new reports that can be generated with a few mouse clicks. For example, an analyst responsible for creating a 6-month stability report for a batch of tablets might simply start to enter the tablet batch number in the reporting application in Application Group 5, which auto-completes the text entry midstream (because the values are validated). The analyst then chooses the 6-month time point from a drop down list and clicks a button to request the report, which is generated and provided in a few seconds (the data being aggregated on-the-fly by the database). Importantly, all the content of the report is valid, enforced by the current Report Template. Likewise, the presentation (table formats, significant figures, charts, fonts, headers, footers, etc.) also conforms to currently accepted criteria, enforced by the Report Template. In short, an arbitrarily complex report can be accurately created in a few seconds. Thus, the analyst stops spending countless hours finding data, transcribing data, formatting data, building charts, and creating reports manually. Likewise, managers stop tedious review of data transcription. Instead, time is spent understanding the meaning of the data, identifying trends or outliers, and taking action based on the impact the data has on the project.
What We Need: Getting from Here to There
In this two-paper series, we have tried to be explicitly clear about new, untapped opportunities that await the laboratory. We have also described a potential mechanism (not the only one) to make these concepts a reality. The architecture proposed here is different from many of today’s laboratory software offerings. It is a more open approach to accessing data and controlling laboratory instruments, but it is also more modular with opportunities for new commercially licensed products. In this closing section, the main challenges and next steps toward adoption are summarized.
Open, Shared Schema
The architecture proposed here requires a shared language, a foundation on which everything else rests: the content stored in the document-based PDS and BRTR. This amounts to a holistic, open and shared schema – a common definition used by all instrument vendors, similar in spirit to the open, vendor-neutral AnIML instrument data format [8]. Successful implementation and adoption of these standards will require iterative development and an unprecedented level of collaboration between leaders in industry, academia, instrument vendors, and regulatory agencies.
Closed, Proprietary Implementation
Everything above the BRTR and PDS in Figure 1 can, and should be, a vendor-specific, commercially licensed product. Competition at the level of services, databases, and modular applications will produce the best products for customers. Using the shared schema, software vendors are free to differentiate themselves and compete for customers at this new level: that of the modular application and service. From a vendor’s perspective, the smaller, modular applications can be configured and combined in nearly limitless ways to gain customers in new markets: CROs, small biotech and large pharmaceutical companies, academic and government labs, and different chemical industries can all have variations, using the same foundation.
Next Steps: An Open Discussion of Risks, Costs and Benefits
From an instrument software vendor’s perspective, there are several risks and benefits associated with adopting this approach: loss of closed data formats, loss of vendor-specific instrument control, “it’s been tried before.” We do believe, however, that there are valid financial incentives for moving in this direction, not the least of which is that someone will do it (consider the MP3 file standard and the music industry). These risk-benefit-cost issues are too complex to address in a short communication and the authors believe that these topics are best discussed in person. What is needed is a mechanism to bring together representatives from industry, academia, instrument vendors, and regulatory agencies to discuss how laboratories can move toward more open, scalable and adaptable work practices. Please contact us if you have questions or criticisms.
References
- Roberts, J.M., Bean, M.F., Cole, S.R., Young, W.K., Weston, H.E., American Pharmaceutical Review, September/October 2010, p. 60 – 67.
- Complexity: A Guided Tour, 2009, Oxford University Press, Oxford, Melanie Mitchell.
- Code of Federal Regulations Title 21, Part 11.
- Proceedings, iRODS User Group Meeting 2010: Policy-Based Data Management, Sharing and Preservation, Edited by Reagan W. Moore, Arcot Rajasekar, Richard Marciano.
- Introduction to Algorithms, 2nd Edition, 2001, The MIT Press, Cambridge, MA, p 138 – 140, Thomas H. Cormen, Charles E. Leiserson, Ronald L. Rivest, Clifford Stein.
- Head First Design Patterns, 2004, O’Reilly Media, Inc., Sebastapol, CA, p 254 – 270, Eric Freeman, Elisabeth Freeman.
- Design Patterns: Elements of Reusable Object-Oriented Software, 1995, Addison-Wesley, Reading, MA, p 185 – 193, Erich Gamma, Richard Helm, Ralph Johnson, John Vlissides.
- See http://www.scientificcomputing.com/the-iupac-astm-unified-standard.aspx.
Author Biographies
Dr. James M. Roberts works in an automation group in Product Development at GlaxoSmithKline. He applies informatics, data integration, modeling, and automation to increase efficiency in analytical chemistry. He received a Ph.D. under the advisement of Professor Janet Osteryoung and has 12 years of experience in the pharmaceutical industry.
Dr. Mark F. Bean, Investigator at GlaxoSmithKline, has worked with automated MS and software solutions for research chemistry LCMS for 20 years. He was the architect-project lead for CANDI, a vendor-neutral LCMS login, processing, and results viewing suite used by GSK in the Philadelphia area. He is a founding member of the ASTM committee charged with the AnIML analytical data standard.
Dr. William K. Young is an Investigator in Analytical Sciences at GlaxoSmithKline in Stevenage, UK. He develops and maintains the walk-up chromatography systems within Chemical Development. He received his Ph.D. from Imperial College, London with Professor W. John Albery and has 11 years experience in the pharmaceutical industry.
John C. Hollerton is a Director of Analytical Chemistry at GlaxoSmithKline. He leads a team who offer spectroscopic and small molecule X-ray crystallography support to R&D as well as informatics support to Analytical Chemistry. He has spent the last 30 years integrating informatics in the analytical environment. He was responsible for the design and implementation of GSK’s Global Analytical Data Repository (GADR).
Dr. Chris Bizon is a Senior Research Scientist in Informatics at the Renaissance Computing Institute. He currently leads a group designing cyberinfrastructure for high-throughput genomic sequencing. He received his Ph.D. in physics at the University of Texas at Austin with Professor Jack Swift and has worked in both the academic and industrial settings
This article was printed in the January/February 2011 issue of American Pharmaceutical Review - Volume 14, Issue 1. Copyright rests with the publisher. For more information about American Pharmaceutical Review and to read similar articles, visit www.americanpharmaceuticalreview.com and subscribe for free.