By - Lizbeth Martínez,* Camille Adler, Julie Neumuller, Michael Juhnke, and Sanni Matero - Novartis Pharma AG, Pharmaceutical Development Unit, CH-4002 Basel, Switzerland
* Corresponding author at: Novartis Pharma AG, WSJ-187/3/231.33 CH-4002 Basel, Switzerland. [email protected]
Abstract
Over the last decades Process Analytical Technology (PAT) has been widely used in pharmaceutical development to support process understanding and optimization. Among the different technologies, Near Infrared Spectroscopy (NIRS) has maintained its status as a most versatile and valuable PAT tool for probing the manufacturing of solid dosage forms. Two industrial examples of PAT NIRS applications are presented in this paper. The first case tackles the challenges of process development in an international environment, with different locations for manufacture and traditional analytics. The study shows how it was possible to troubleshoot segregation by means of in-line monitoring of the blending process combined to an at-line content uniformity determination on a high number of tablets. The second case describes in-line monitoring by NIRS for assay determination in a wet media milling process of a nanosuspension.

Introduction
Process analytical technologies have been utilized for decades in the chemical, food and oil industry, and in the last 10+ years various PAT applications have evolved in pharmaceutical manufacturing under the umbrella of the FDA PAT initiative.1 Health authorities encourage
pharmaceutical industries to use PAT as a key element of current Good Manufacturing Practice.2 As a real time process control tool, PAT can be the source of a rich dataset collection, for modeling and Quality by Design (QBD) approaches. This can support process understanding, scale-up, data-driven decisions and release. In addition, the use of validated PAT methods can enable lean and efficient quality control strategy. As equipment independent tools, PAT can be part of a performance-driven filing, which is in the scope of ICH Q12.3
Many different facets in pharmaceutical production offer a momentum of integrating PAT into the system such as solid dosage form manufacturing involving many unit operations that possess multivariate and interrelated characteristics that need to be controlled and understood.4,5 Moreover, throughout the life cycle of a drug product pharmaceutical companies involve different locations for the development phase, final production or analytical controls. This can lead to challenges in terms of process or method transfers, which should always ensure that critical quality attributes (CQAs) are met and that critical process parameters (CPPs) are under control. In this context, PAT is seen as a powerful tool replacing off-line testing and providing real-time information of product quality.6
The most commonly used PAT technologies are Raman and NIR spectroscopy.7–9 Other less used techniques such as microwave resonance, acoustic emission, and terahertz pulsed imaging also enrich the PAT toolbox.10,11 NIRS has attracted a special interest from the pharmaceutical industry since it allows analysis of samples without previous pretreatment, therefore reducing or eliminating wet chemistry analysis.
Examples how PAT can be applied in different unit operations of solid dosage form manufacturing to better understand the interactions between the material characteristics and process related variation are the following:
- In/on-line PAT methods: enables real-time process control/monitoring
- Off-line PAT methods: enables replacing reference analysis with faster non-destructive testing
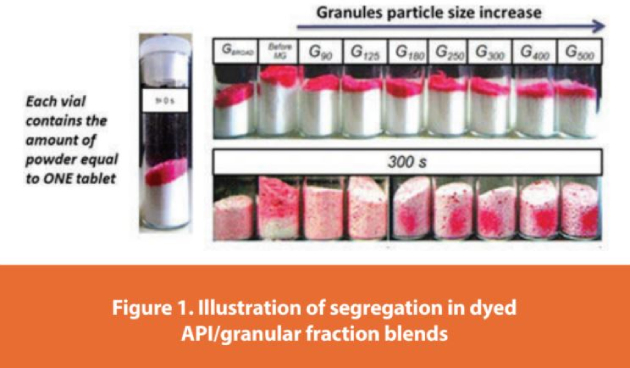
- Blending: PAT tools can be used for blending uniformity (BU) determination on-line (or off-line). BU information is gathered in the course of blending time and decisions can be made based on a statistical model combined with acceptance criteria when BU is reached. This enables avoidance of off-line thief sampling that may introduce bias of homogeneity.12,13 Moreover, PAT tools can be used for troubleshooting e.g., in case BU or content uniformity (CU) indicate issues in the blending process or with raw materials. Out of specification BU or CU values may be linked to material segregation or demixing during the blending, which is often caused by particle size incompatibilities. Figure 1 aims to exemplify why particle size is a critical parameter for blending. In order to show the importance of particle size in a blending process, granular fractions of different patricle size distributions (PSD) were mixed with a dyed active pharmaceutical ingredient (API) for visual identification of segregation problems.14,15 One can clearly see how segregation worsens by increased size differences of granules and API (Figure 1). PAT tools can help identify inhomogeneities and segregation in mixing.16,17
- Granulation: PAT tools can be used for monitoring dry, wet or melt granulation processes in-line and evaluate critical quality attributes of granules, such as PSD and water content in real-time.18 PAT also enables non-destructive off-line granule quality evaluation.
- Hot-melt extrusion: PAT tools can be used to monitor the solid-state and polymer-drug interactions,19 which is of high interest in the frame of solid dispersion formulations, or to evaluate the residence time distribution in the barrel.20
- Fluidized bed drying: PAT tools enable on-line monitoring of the drying process. PAT enables non-destructive real-time predictions of water content that enables decisions to be made for the drying end-point.21
- Content uniformity (CU): PAT tools can be used for assessing CU by collecting data from tablets and correlate it with the HPLC reference CU value.22,23 The non-destructive method enables fast testing of even hundreds of tablets and is suitable for real-time release testing.
- Post packaging analysis (PPA): PAT tools can be used for fast and non-destructive material identification e.g., by collecting data from tablets and comparing data with drug product and placebo tablets for identification.
During development of the drug product process, each unit operation brings challenges that need to be assessed in order to prevent compromising the quality of the final product. This article aims at illustrating the usefulness of PAT tools -NIRS in this case- in pharmaceutical drug product development through two real world case studies.
Case Study 1: Segregation During Tablet Compression
During the development of pharmaceutical products, process transfers take place and often involve different production scales or different manufacturing sites. Understanding of the risks and fast data acquisition can hasten the implementation of the manufacturing process and enables a better understanding of the different unit operations. This case study shows the value that an NIRS PAT tool can offer for blending and compression of a formulation containing 21% of drug substance contained in granules. During the process development the drug product was manufactured at different scales (lab and pilot) involving in-line blending monitoring by NIRS. The NIR blending monitoring proved the same results as HPLC analysis; a stable blending process with desired level of homogeneity. In addition, a partial least square (PLS) model for the content uniformity determination using tablet cores was developed and validated for the project.
During the process transfer to the launch facility, NIRS was used for in-line monitoring of the different blending steps showing that the blend reached homogeneity. However, when the tablet cores collected throughout the compression process were analyzed by CU by NIRS, a clear segregation trend going from low to high drug substance concentrations was observed (Figure 2). The NIRS predictions for CU were confirmed by HPLC on the same tablet cores, showing good correlation between NIRS and HPLC methods (Figure 2). NIR data collected during blending was used for ruling out issues with blend inhomogeneity and supporting further investigation of the process. After the final blending and prior to compression, a free fall of powder took place. Thus, as an outcome of PAT-assisted investigation, the free fall of powder was identified as the root cause of the segregation. The free fall of the final blend was eliminated for the next manufacturing campaigns.

This case study demonstrates the potential of using NIRS during the pharmaceutical process development for getting a better insight of the process, support of root cause investigations, and enables fast sample evaluation.
Case Study 2: In-Line Assay Determination in a Nanosuspension During Wet Media Milling
In this second example, an NIR model was developed to monitor the API concentration during the first pharmaceutical step of the process, consisting of wet media milling for the generation of a nanosuspension. Knowing the precise concentration of API contained in the nanosuspension is critical for the following manufacturing steps, since it can have a direct impact on the content uniformity of the final dosage form. Therefore, traditional set-up includes sample collection and analysis in the quality control lab for assay determination using wet analytics (commonly HPLC), causing the nanosuspension to be held until the results are available. Here NIRS was evaluated as an alternative to off-line analytics for the quantification of API for this intermediate step. For the assay determination a PLS model was developed.
In this process, a drug micro-suspension was fed into the recirculation vessel of a mill. The suspension was then circulated in a loop through the grinding chamber containing stirred grinding media for several hours, until the desired particle size is obtained.24 The NIR spectrometer was installed in-line in the pipe between vessel and suspension inlet into the grinding chamber.
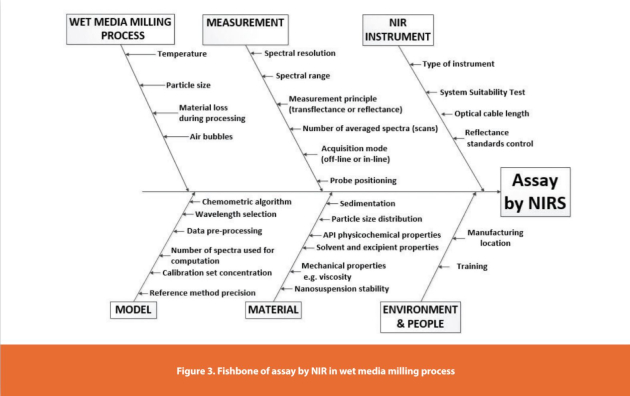
For the generation of accurate and robust NIRS procedures one has to have a clear understanding of the variance sources taken into account before starting calibration and validation activities. The fishbone in Figure 3 represents the complexity that surrounds the development of an NIRS for assay in a wet media milling process thus the cross-disciplinary experts should conduct the assessment together.
In feasibility trials, the measurement principle, the positioning of the probe as well as the measurement settings were evaluated, leading to the choice of a reflectance probe installed in the recirculation loop.
During setting up of the preliminary chemometric model, the transflectance probe seemed to be giving better results.
However, during the first in-line tests at lab scale, the reflectance probe dealt much better with air bubbles generated during processing and was chosen. Other parameters associated to the process and to the material were evaluated and controlled, as they can have an impact on the assay value given by the NIR spectrometer.

The PLS calibration model corresponds to a hybrid approach using synthetic samples generated at lab scale and samples collected during the process in order to include the process signature. The PLS model was successfully used for the in-line monitoring of assay at the launch facility, as shown in Figure 4. The evolution of assay during initial processing time is associated with the applied operational procedure (Figure 4).
Conclusions
PAT in development of pharmaceutical processes can be used for in-depth process understanding, product quality assessment and real-time process monitoring via timely and non-destructive measurements from the process stream. These case studies from the pharmaceutical industry show the value that NIRS offers as a fast and reliable alternative for wet chemistry analysis during blending, compression and in-line assay determination in a nanosuspension wet media milling. The PAT activities were conducted at different locations and manufacturing scales including development and process transfer. In addition, PAT tools can support troubleshooting as shown with the in-line monitoring of the blending process, which was used for guiding root cause investigation of segregation issue. PAT tools and leveraging PAT-assisted knowledge in pharmaceutical development is invaluable for sustaining product quality in process changes and transfers.
References
- Food and Drug Administration. FDA Guidance for Industry: PAT - A Framework for Innovative Pharmaceutical Development, Manufacturing and Quality Assurance. Published online September 2014.
- Chew W, Sharratt P. Trends in process analytical technology. Anal Methods. 2010;2(10). doi:10.1039/c0ay00257g
- INTERNATIONAL COUNCIL FOR HARMONISATION. Technical and regulatory considerations for pharmaceutical product lifecycle management Q12. Published online November 2019.
- Yu LX, Amidon G, Khan MA, et al. Understanding pharmaceutical quality by design. AAPS J.2014;16(4). doi:10.1208/s12248-014-9598-3
- Matero S, Den Berg F van, Poutiainen S, Rantanen J, Pajander J. Towards better process understanding: Chemometrics and multivariate measurements in manufacturing of solid dosage forms. J Pharm Sci. 2013;102(5). doi:10.1002/jps.23472
- Martinez L. Using PAT to accelerate and optimize the process development of solid dosage forms. In: International Forum Process Analytical Chemistry, IFPAC; 2021.
- Roggo Y, Chalus P, Maurer L, Lema-Martinez C, Edmond A, Jent N. A review of near infrared spectroscopy and chemometrics in pharmaceutical technologies. J Pharm Biomed Anal.2007;44(3 SPEC. ISS.). doi:10.1016/j.jpba.2007.03.023
- Rantanen J. Process analytical applications of Raman spectroscopy. J Pharm Pharmacol.2010;59(2). doi:10.1211/jpp.59.2.0004
- De Beer T, Burggraeve A, Fonteyne M, Saerens L, Remon JP, Vervaet C. Near infrared and Raman spectroscopy for the in-process monitoring of pharmaceutical production processes. Int J Pharm. 2011;417(1-2). doi:10.1016/j.ijpharm.2010.12.012
- Korasa K, Vrečer F. Overview of PAT process analysers applicable in monitoring of film coating unit operations for manufacturing of solid oral dosage forms. Eur J Pharm Sci.2018;111:278-292. doi:10.1016/j.ejps.2017.10.010
- Matero S, Poutiainen S, Leskinen J, et al. The feasibility of using acoustic emissions for monitoring of fluidized bed granulation. Chemom Intell Lab Syst. 2009;97(1):75-81. https://doi.org/10.1016/j.chemolab.2008.11.001
- Muzzio FJ, Robinson P, Wightman C, Dean Brone. Sampling practices in powder blending. Int J Pharm. 1997;155(2). doi:10.1016/S0378-5173(97)04865-5
- El-Hagrasy AS, D’Amico F, Drennen JK. A process analytical technology approach to near-infrared process control of pharmaceutical powder blending. Part I: D-optimal design for characterization of powder mixing and preliminary spectral data evaluation. J Pharm Sci.2006;95(2). doi:10.1002/jps.20467
- Martinez L, Mixing of Particulate Material Studied by NIR . In: International Conference of Near Infrared Spectroscopy, ICNIRS; 2013.
- Martínez L, Peinado A, Liesum L. Mixing of Particulate Material Studied by near Infrared Spectroscopy. NIR news. 2015;26(3):4-7. doi:10.1255/nirn.1520
- Skibsted ETS, Boelens HFM, Westerhuis JA, Witte DT, Smilde AK. Simple assessment of homogeneity in pharmaceutical mixing processes using a near-infrared reflectance probe and control charts. J Pharm Biomed Anal.2006;41(1).doi:10.1016/j.jpba.2005.10.009
- Bellamy LJ, Nordon A, Littlejohn D. Effects of particle size and cohesive properties on mixing studied by non-contact NIR. Int J Pharm. 2008;361(1-2).doi:10.1016/j.ijpharm.2008.05.030
- Rantanen J, Wikström H, Turner R, Taylor LS. Use of in-line near-infrared spectroscopy in combination with chemometrics for improved understanding of pharmaceutical processes. Anal Chem. 2005;77(2). doi:10.1021/ac048842u
- Saerens L, Dierickx L, Quinten T, et al. In-line NIR spectroscopy for the understanding of polymer-drug interaction during pharmaceutical hot-melt extrusion. Eur J Pharm Biopharm. 2012;81(1). doi:10.1016/j.ejpb.2012.01.001
- Wesholowski J, Berghaus A, Thommes M. Inline determination of residence time distribution in hot-melt-extrusion. Pharmaceutics. 2018;10(2). doi:10.3390/pharmaceutics10020049
- Rantanen J, Jørgensen A, Räsänen E, et al. Process analysis of fluidized bed granulation. AAPS PharmSciTech. 2001;2(4). doi:10.1007/BF02830561
- Sulub Y, LoBrutto R, Vivilecchia R, Wabuyele B. Near-infrared multivariate calibration updating using placebo: A content uniformity determination of pharmaceutical tablets. Vib Spectrosc. 2008;46(2):128-134. doi:https://doi.org/10.1016/j.vibspec.2007.11.004
- Xiang D, Lobrutto R, Cheney J, et al. Evaluation of transmission and reflection modalities for measuring content uniformity of pharmaceutical tablets with near-infrared spectroscopy. Appl Spectrosc. 2009;63(1). doi:10.1366/000370209787169696
- Li M, Azad M, Davé R, Bilgili E. Nanomilling of drugs for bioavailability enhancement: A holistic formulation-process perspective. Pharmaceutics. 2016;8(2). doi:10.3390/pharmaceutics8020017
Author Biographies
Lizbeth Martinez holds a PhD in Pharmaceutical Technology from the University of Basel in Switzerland. Her research has been focused on the implementation of PAT tools for the real time monitoring of pharmaceutical processes in batch and continuous modalities. Since 2011, Lizbeth has been working for Novartis Switzerland under different expert positions related to PAT and process validation. She combines pharmaceutical process understanding with PAT tools and data science for optimization, troubleshooting and release of pharmaceutical products.
Camille Adler holds a PhD in Pharmaceutical Technology from the University of Basel in Switzerland. She conducted research on the formulation and characterization of a poorly water soluble API by hot-melt extrusion. Since 2017, Camille is a consultant providing services to Novartis Switzerland. Her work is focused on the late phase development of oral solid dosage forms and process transfers and recently joined the PAT expert team.
Sanni Matero holds a PhD in Chemometrics from the University of Eastern Finland. Her main area was developing models for pharmaceutical processes and analyze pharmaceutical data which she continued doing during her postdoctoral research in University of Copenhagen. Since 2012 Sanni has been working in Novartis Switzerland as a PAT chemometrician and currently as a data scientist in PAT team in Technical R&D.
Julie Neumuller has studied chemistry in the University Institute of Technology of Strasbourg, in France. Since 2009, Julie has been developing drug substance’s crystallization, filtration and drying processes for Novartis Switzerland as a laboratory scientist. In addition, she has enthusiastically been supporting the PAT team in Technical R&D with feasibility studies of NIRS for chemical and pharmaceutical processes, and implementing them in lab, pilot and production scale.
Michael Juhnke holds a PhD in Particle Technology from Technical University of Clausthal in Germany. He is appointed Honorary Professor from Technical University Braunschweig in Germany. His research has been focused on the development and manufacturing of API and drug product from pre-clinical to commercial stage. Since 2006, Michael has been working for Novartis Switzerland under different expert and team head positions in Technical R&D.
Subscribe to our e-Newsletters
Stay up to date with the latest news, articles, and events. Plus, get special offers
from American Pharmaceutical Review – all delivered right to your inbox! Sign up now!