Terry E Munson- Retired, Former FDA; Karen Zink McCullough- MMI Associates, LLC
Abstract
Laboratory analysts who have been performing compendial Bacterial Endotoxins testing (BET) for a number of years have come to accept the idea that the range of error of any BET compendial assay is 50- 200%. The reality is, the real error of any of the compendial bacterial endotoxins tests is unknown. The following discussion examines the genesis, history, and application of the 50-200% range.
Introduction
The Limulus Amebocyte Lysate test was first described in the Federal Register fifty years ago (Federal Register, 1973). At that time, the only available test method was the gel clot test, which is still the current “referee” test in the harmonized Bacterial Endotoxins Test (BET) method (USP 2023). Since the introduction of the photometric assays in the late 1980s, the gel clot test has been replaced in most laboratories by the more quantitative kinetic assays - kinetic turbidimetric and kinetic chromogenic.
Today, the industry is looking at new alternate BET assays that are not dependent on animals, either as a test subject or as a source of reagent. Most of these alternate assays cite the same reference/ calibration standards (RSE/CSE), the same standard curve ranges and the same basic assay tenets used by the compendial photometric assays. These alternative tests use several different platforms including the utilization of one or more recombinant proteins in the horseshoe crab’s natural clotting cascade to measure endotoxins activity (Loverock et al, 2003; Mizumura, et al, 2017) and assays that use whole blood or Peripheral Blood Mononuclear Cells to measure cytokine responses to pyrogenic materials, including endotoxins (Hartung, et al, 2002). Most alternative assays report results in Endotoxin Units (EU), or a variation thereof called “EU Equivalents”. In consideration of ongoing discussions regarding equivalence of the test results reported by these alternate methods to the current compendial assays, it’s important to understand the origin and application of the 50-200% Positive Product Control recovery range.
Gel Clot
The gel clot test is the basic LAL assay that has served the pharmaceutical industry and has assured patient safety for 50 years. However, it suffers from three significant constraints:
- There is no continuous standard curve. Rather, the test reference is a discrete series of twofold dilutions of the calibration analyte (RSE or CSE) made to “bracket” the lysate sensitivity (reference Table 1).
- The test results are binary. After incubation, each tube containing either a standard or a sample + lysate reagent is removed from incubation and is slowly rotated 180°. If a firm gel has formed that maintains its integrity upon inversion, the test is positive. Anything else is negative.
- Analyst technique is important in the reading and interpretation of results. If the tube is not rotated in a smooth, slow and consistent motion, the fragile gel could be disturbed. Once disturbed, it will not re-form, causing a false negative test result.
Where did the concept of plus/minus one twofold come from? Table 1 represents a series of standards and results of a gel clot label claim verification study (USP, 2023). The test sensitivity (label claim or λ) is 0.25 EU/mL. The column entitled “RSE/CSE” represents the requisite twofold serial dilution of the calibration standard in Water for BET to bracket the label claim sensitivity of the reagent. The endpoint of each series is defined as the last positive tube followed by a negative one. Five possible sets of standard series results are provided in Table 1.

The endpoint for series A is 0.25 EU/mL and matches the label claim sensitivity “on the nose.” However, if the analyst doesn’t match the lambda endpoint exactly, there are only two ways to go – one twofold dilution up (series B where the endpoint is 0.5 EU/mL) or one twofold dilution down (series C where the endpoint is 0.125 EU/mL). A requirement to match λ exactly under the conditions of the gel clot test is rigid given the biological nature of the reagents, so the “rule” evolved to confirm the label claim plus or minus one twofold dilution because that’s the best that the test can do. That sounds reasonable given the constraints of method and variability in sample preparation, but it’s really a 50-200% swing relative to λ. Examples D and E are invalid because there are no endpoints.
Intuitively, the real endpoint of Series A lies somewhere between 0.25 EU/mL and 0.125 EU/mL, but the configuration of the test doesn’t allow for that kind of resolution . Therefore, one twofold dilution is the resolution of the gel clot test, meaning that it is the best the test can do to resolve the difference between two values.
Perhaps “error” was a technically improper term to apply to this two-fold interval, although the terms accuracy and resolution are often used interchangeably. Accuracy describes how close a measured value is to the true value while resolution is the smallest distinguishable difference in results that the method can produce. While they are similar, and while accuracy is to a large degree dependent on resolution, they are not the same.
Photometric Tests
Upon their introduction, the photometric tests addressed and resolved the three major constraints of the gel clot test as well as the resolution issue. Rather than a discrete series of twofold dilutions, the photometric tests allowed for a continuous standard curve to be drawn from the kinetics of the activity of each diution in an RSE or CSE standard series. Figure 1 is a depiction of the kinetics of a series of calibration standards plotted as optical density (or color) as a function of time. The highest concentration in the series is on the left, and each of the subsequent curves represents decreasing concentrations of the standard.
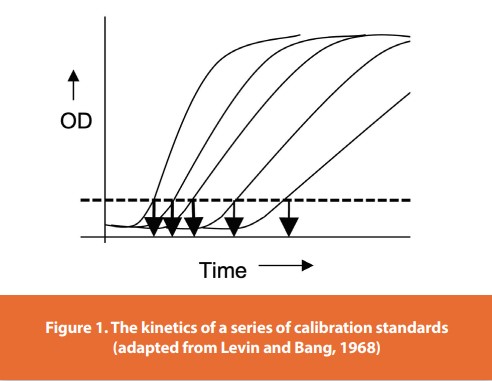
The dashed line in Figure 1 is called the Onset Optical Density, which is a pre-determined level of turbidity or color recommended by the manufacturer of the reagent. The downward arrows represent the time it takes for each standard to generate sufficient turbidity or color to reach the Onset OD. These individual times are called the Onset Times or Reaction Times. In Figure 1, the highest standard concentration has the shortest or quickest Onset Time. What is important to note is that each of these standards has a lag time and a reaction rate (slope) that are representative of the endotoxins activity: more concentrated (higher) calibration standard dilutions have a shorter lag time and react faster (steeper slope) than lesser concentration standards (Levin and Bang, 1968).
If the Onset Times for a series of standards are plotted as a function of endotoxin concentration, the graph looks like Figure 2a - hardly useful for routine endotoxins analysis. However, transforming the data by plotting the log of the onset time for each standard as a function of the log of its endotoxin concentration gives a straight line standard curve with a negative slope. Lower concentrations in the standard series take longer to reach the Onset OD (Figure 2b). Therefore, the convention in the harmonized BET Chapter is to transform the data to establish a linear standard curve from which the endotoxins activity in a sample or a back calculation for a standard can be interpolated (dashed line in Figure 2b).
This transformation is most helpful in making a usable standard curve, but it reinforces the fact that a photometric test result is different than a gel clot result in that 1) it is dependent on time rather than gelation, and 2) due to the log transformation of the data, small changes in the onset time can have significant impact on the quality of the standard curve and ultimately the accuracy of the test result.
What is the “error” of the photometric tests? Dr. Ronald N. Berzofsky, formerly of Cambrex (now Lonza) suggested that the real error of a photometric test, based on reproducibility of reaction times for the calibration standard diluted in Water for BET, is about 10%. So where did 50-200% “validity criteria” for the photometric Positive Product Control (PPC) come from?
The accuracy and therefore the total error of any photometric test are dependent on the quality of the standard curve (slope, y-intercept and correlation coefficient), which means that the accuracy of the test result is ultimately dependent on the onset times (McCullough, 2011). Sources of onset time variability include but are not limited to the following:
• Dilution schemes and techniques
• Pipetting technique
• Uneven plate heating
• Endotoxin contamination, adsorption, or extractable/ leachables in accessories such as plates and pipette tips
• Timing of the addition of reagents to plates
• Product-specific interference
While the lysate as purchased and tested using Water for BET may exhibit an error of 10%, the real error of the test depends on the laboratory’s level of assay understanding and state of control. Because of the number of potential input variables, the correct answer to the question of overall error in a photometric test is “We don’t know”. What we do know is that defaulting to a 50-200% “error” or “validity” range for PPC recovery is scientifically unsupported.
The Interim Guidance on the use of kinetic tests provided by FDA in 1991 (now retired) was prescient in many ways. Italicized words are quotes from this document:
The performance characteristics (slope, y-intercept and correlation coefficient,) for the lysate lot sent by the manufacturer will not be valid. New performance characteristics have to be established for each lot by performing the procedures outlined in Appendix A (creation of a standard curve).
When the number of reagent vendors and instruments were limited, the reagent manufacturer would add slope and y-intercept determinations on the reagent Certificate of Analysis and the user would have to match those values. As the number of vendors and instruments increased, it became apparent that the standard curve parameters could, and often did, change with the combination of reagent and instrument or from instrument to instrument. It is important to note that FDA recognized early on that standard curve parameters other than correlation coefficient were important and that they were dependent on individual laboratory conditions.
The Guidance went on to describe the Positive Product Control:
The calculated mean amount of endotoxin when referenced to the standard curve, minus any measurable endogenous endotoxin in the spiked drug product, must be within plus or minus 50% of the known spike concentration to be considered to neither enhance nor inhibit the assay. If there is no measurable endogenous endotoxin in the product, the value will usually be equal to or less than plus or minus 25% of the standard curve value.
The original Guidance had no reference to the range of 50-200%, but made a distinction between recovery in samples with no detectable endotoxin background (± 25%) and samples with high levels of background endotoxin (± 50%). The reason for the two recommended recoveries is that high background (contamination) in a test sample will tend to mask a much lower PPC value.
However, neither the requirement to control the quality of the standard curve other than correlation coefficient, nor understand the potential impact of background endotoxins on the recovery of the PPC made it into USP , as adding these requirements presented new challenges to the implementation of photometric methods in the QC laboratory. The 1991 Guidance was retired in 2012 with the publication of FDA’s Question and Answer Guidance (FDA, 2012).
The gel clot reagent verification and the Test for Interfering Factors both make reference to the method’s plus/minus one twofold test resolution (50-200% of lambda). However, there is no validity range for a PPC recovery in a gel clot test because the PPC level is set at 2 lambda (test resolution), and it MUST gel. Reagent verification and Test for Interfering factors are different in photometric tests, and are not constrained by test method resolution. The twofold resolution range was passed along to photometric PPC recovery to ease the path for a laboratory to move from the gel clot limits test to the more quantitative tests, and was justified at the time because all of the reagents came from the same source (Limulus lysate). In other words, the 50-200% PPC “validity range” is not related to any photometric assay attribute or capability.
In retrospect, that decision, while well intended to advance endotoxins testing beyond gel clot, perpetuated a misunderstood and scientifically unfounded parameter regarding variability and error in the photometric tests. What is important now is that QC laboratories that employ the BET understand the origin of 50-200% as a residual attribute of only the gel clot test and recognize that it does not define the error of any bacterial endotoxins test method.
Equivalence of Alternatives to <85>
Why is this information important to the assessment of alternatives to the compendial assays?
Figure 3 is an example of “relative recovery” calculations of a data set in the public domain comparing an alternative assay to a compendial photometric LAL test. For this exercise, the value for any one sample generated by the LAL test result is assumed to be correct given that it is a validated test in a compendial chapter numbered under 1000. The percent relative recovery for the alternate method is calculated by dividing the result obtained using the alternative test method by the result obtained on the same sample obtained by the LAL comparator. and multiplying the quotient by 100. For example, if the LAL test of a contaminated sample measures 46 EU/mL and the alternative test measures 42 EU/mL, the percent recovery of the alternative test to the compendial test is [(42 EU/mL) ÷ (46 EU/mL)] x 100 = 91% recovery. In other words, the alternative test measured 91% of the activity that the compendial test measured. In figure 3, each column represents a single sample that was tested on both the compendial and the alternative tests. The height of the column represents the recovery of endotoxins activity relative to the LAL photometric, denoted as 100% by the dotted line. The shaded box represents 50-200% of endotoxins activity recovery relative to LAL. Graphically, all of the recoveries in Figure 3 appear to fall within the 50-200% range, so one might conclude that the proposed alternative test and the compendial test are therefore equivalent.

However, this inference is unfounded, as the data represented in this study not only reference a “validity range” that is scientifically unsupported for either method, but also does not contain a confidence interval or a justified equivalence interval, both of which are required for the assessment of true statistical analysis of equivalence (Hauck, et al, 2009).
Subjecting these same data to a statistical analysis of equivalence (two one-sided test, or TOST) reveals that the alternative method is not equivalent to the compendial test at an equivalence interval of 0.3 or ±30% and a confidence interval of 95%. So while relative recovery using a range of 50-200% seems on one hand to be a reasonable graphic way to compare test methods, it may not align with accepted, standard statistical analyses for equivalence.
Implications of the 50-200% PPC Recovery Range
The point of the PPC is to prepare the test article so that the calibration standard added to the prepared product acts like the analogous point on the calibration curve, which is standard prepared in water. The PPC is really one indicator of accuracy. For example,
- If the PPC in a prepared product recovers 58% of the actual test result, OR there are issues with the standard curve that affect spike recovery, we must assume that there is something going on in the sample that is interfering with the recovery, and that this same interference might affect the actual test result.
- Acceptance of the 50-200% range suggests that the laboratory also accepts that a reported test result is accurate to within the range of 50-200% of its reported value. Therefore, a test result of 14 EU/mL against a limit of 25 EU/mL would fail under the “validity” assumption because the is assumed to be accurate to within a 50-200% range of the reported value.
- Test results for kinetic tests and alternate tests are often reported out to three decimal places, which suggests a degree of accuracy is inconsistent with simultaneous acceptance of an “error”/”recovery range”/”verification range” of 50-200%.
Summary
In summary, 50-200% is neither the calculated error of any compendial BET assay nor is it an appropriate parameter for evaluating the equivalence of two test methods. The range was originally derived from the resolution of the gel clot test method that was applied to the kinetic PPC, based on the source of the reagent to ease the transition between gel clot and photometrics. Consequently, the true error of any photometric test is unknown, but variability, which can lead to inaccuracy, can be controlled almost exclusively in the laboratory by careful control of standard curve generation and sample preparation.
Literature Cited
Berzofsky, Ronald N. 2014. Test Variability: Artifacts and Attributes That Can Affect Endotoxin Recovery. Bacterial Endotoxin Summit. May, 2014
Federal Register January 1973. Federal Register Vol. 38, No. 8 p. 1404.
FDA. 1990. Interim Guidance for Human and Veterinary Drug Products and Biologials: Kinetic LAL Techniques (retired)
FDA. 2012. Guidance for Industry: Pyrogen and Endotoxins Testing: Questions and Answers. https://www.fda.gov/regulatory-information/ search-fda-guidance-documents/guidance-industry-pyrogen-and endotoxins-testing-questions-and-answers
Hartung, Thomas, Members of the Human€ Pyrogen Test Study Group. 2002. Comparison and Validation of Novel Pyrogen Tests Based on the Human Fever Reaction. ATLA 30, Supplement 2, 49-51.
Hauck, W.W., A.J. DeStefano, T.L. Cecil, D.R. Abernethy, W.F. Koch, R.L. Williams. 2009. Acceptable, Equivalent, or Better: Approaches for Alternatives to Official Compendial Procedures. Pharmacopeial Forum 25(3): 772-778
Levin, J and F.B. Bang. 1968. Clottable Protein in Limulus: Its Localization and Kinetics of its Coagulation by Endotoxin. Thrombosis et Diathesis Harmorrhagica. 19(1): 186-197
Loverock, Bruce, Barry Simon, Allen Burgenson, Alan Baines. 2010. A Recombinant Factor C Procedure for the Detection of Gram-negative Bacterial Endotoxin. Pharmacopeial Forum, Stimulus to the Revision Process. Vol. 36(1).
McCullough, Karen Zink. 2011. Constructing and Interpreting Standard Curves for Quantitative BET Assays. In: The Bacterial Endotoxins Test A Practical Guide. Karen Zink McCullough, editor. DHI Publishing, River Grove, Illinois.
Mizumura, Hikaru, Norihiko Ogura, Jun Aketagawa, Maki Aizawa, Yuki Kobayashi, Shun-ichiro Kawabata, Toshio Oda. 2017. Genetic engineering approach to develop next-generation reagents for endotoxin quantification. Innate Immunity. 23(2): 136-146
United States Pharmacopeia. 2023. , “Bacterial Endotoxins Test”
Author Biographies
Terry Munson is a former FDA Microbiologist, Compliance Officer and Director of Sterile Drug Compliance in FDA’s CDER Office of Compliance. He was the lead author for the 1987 “Guideline on Validation of the Limulus Amebocyte Lysate Test as an End-Product Endotoxin Test for Human and Animal Parenteral Drugs, Biological Products and Medical Devices” as well as the 1991, “Interim Guidance for Human and Veterinary Drug Products and Biologicals: Kinetic LAL Techniques” After retiring from FDA, he served as the Technical VP for Parexel Consulting. He is also a former member of the USP Expert Committee, Microbiology General Chapters. He is now retired.
Karen McCullough is Managing Member of MMI Associates, LLC, a consulting company specializing in Pharmaceutical Microbiology, with a focus on the Bacterial Endotoxins Test, and also in Quality Systems development, particularly for start-up ATMP companies. She has held positions as Director of Microbiology, Sr. Director of Quality Compliance and VP of Quality Operations in pharmaceutical, medical device, cell therapy, and CDMO orgaizations. She is a former member of the USP Expert Committee, Microbiology General Chapters.
Subscribe to our e-Newsletters
Stay up to date with the latest news, articles, and events. Plus, get special
offers from American Pharmaceutical Review delivered to your inbox!
Sign up now!