This series on cleaning describes a methodology for developing cleaning processes from a product life-cycle perspective. The first part describes how the principles of Quality by Design can be applied to cleaning characterization; the subsequent parts deal with cleaning validation and monitoring.
Introduction
Cleaning processes are often developed with a trial-and-error mindset that relies more on afterthought than on deliberation and foresight. This “Quality-by-Chance” approach can lead to some adverse consequences, especially during a new product launch where a single day’s delay can cost millions. Such consequences can be prevented if we adopt a systematic approach to cleaning, and develop cleaning processes from a product life-cycle perspective. However, far more than we would like to admit, we have witnessed or heard of events that demonstrate this has not been the mindset or culture. The end result is that cleaning issues are often resolved reactively by adopting an overkill approach, where extreme cycles are developed to assure success. These cycles consume excess energy, cleaning agents, and water; increase equipment turnaround times; and produce more waste.
If we all thought about cleaning in a holistic manner and not just from a compliance perspective, we would be better off in the long run. The industry has made significant progress in this respect; however, there is still much room for improvement. To that end, Quality by Design (QbD) provides a framework for implementing a systematic approach to process design, development and monitoring [1-4]. With the QbD approach, we design and develop a process to ensure predefined quality at the end of the process. Thus, quality is built into the cleaning process rather than being tested in. This requires that we understand the impact of process parameters on product quality, and that the process be continually monitored and modified, as needed, to assure consistent quality over the lifecycle of the product.
QbD also provides a structured framework for integrating process knowledge and fostering innovation. Long-term needs and implications are considered and integrated into the development process proactively. As a result, the cleaning process is more robust and cost-effective. Further, these benefits can be realized while reducing long-term costs associated with cleaning failures, investigations, corrective actions, delays in product launches, and product recalls.
An important element of QbD is process characterization at small scale. In this part of the series we describe a QbD approach to cleaning that leverages soilant characterization at small scale to enhance process understanding and predict cleaning performance at full scale. We also describe how data obtained at small scale can be used to develop efficient, effective and consistent cleaning cycles. You will see how these approaches have been successfully applied through case studies and examples. The true value of gaining process understanding in the laboratory versus in manufacturing is that many more experiments can be run in a shorter timeframe at small scale than at full scale in manufacturing, allowing one to find the edges of failure more easily. Once we understand well the robustness of the cleaning cycle, we can transfer this knowledge to the full-scale cleaning process, thereby greatly enhancing the likelihood of success at full scale, and reducing the overall time to develop and validate a cleaning cycle.
Quality by Design for Cleaning
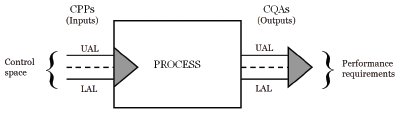
Figure 1 - Schematic representation of a typical process. Each Critical Process Parameter (CPP) or Critical Quality Attribute (CQA) can vary over a specified range defined by its lower and upper acceptable limits (LAL and UAL). The discontinuous line represents the set point.
The objective of Quality by Design (QbD) is to develop robust processes through a better understanding of the relationship between operating conditions (inputs) and performance requirements (outputs). Operating conditions are defined in terms of Critical Process Parameters (CPP) and their respective operating ranges; performance requirements are defined in terms of Critical Quality Attributes (CQA) and their respective acceptable limits. Most processes have multiple CPPs and CQAs. Each CPP or CQA can vary over a specified range defined by its lower and upper acceptable limits (LAL and UAL) as shown in Figure 1. The discontinuous line represents the set point. An approach for identifying CPPs and CQAs, and their respective acceptable limits has been described previously [6-8]. An experimental strategy for identifying the worst-case operating conditions and leveraging them to develop a robust cleaning cycle is described below.
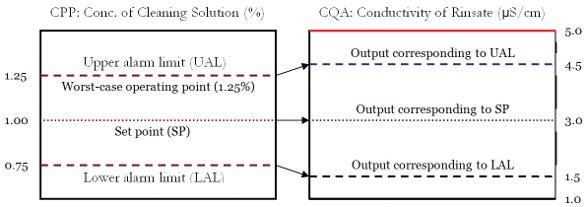
Figure 2 - Traditional versus QbD approach. With the traditional approach the process is characterized with the CPPs at their respective set points. With the QbD approach the process is characterized with the CPPs at their respective worst-case operating points (shown here to be the upper acceptable limit).
The QbD approach to process development for cleaning is demonstrated in the following case study. Consider a cleaning cycle that consists of an alkaline wash followed by successive rinses with water. The traditional and QbD approaches to cleaning characterization are compared in Figure 2, which shows the input-output relationship for the final rinse of a typical cleaning cycle. With the traditional approach, the final rinse is characterized with the concentration of cleaning solution (CPP) at the set point (1%). With the QbD approach, however, the effect of the concentration on the conductivity of the rinsate (CQA) is used to identify the worst-case operating point (1.25%; represented in Figure 2 as the UAL). This is the concentration at which the system is least likely to meet the performance requirements for the conductivity of the rinsate. This worst-case operating point (which is the UAL in this case) is used to challenge the system during characterization. The wider the operating margin between the output corresponding to the worst-case operating point (4.5 μS/cm; blue discontinuous line) and the failure limit (5.0 μS/cm; red line), the more robust the process. An important element of QbD is to strike a balance between the cost of developing a process with wider operating margins (tighter process control), and the higher robustness that results from the tighter control (lower possibility of failure).
Identifying Worst-Case Operating Conditions
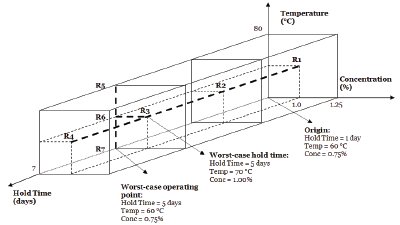
Figure 3 - A seven-run experimental strategy for estimating worst-case operating conditions within the design space.
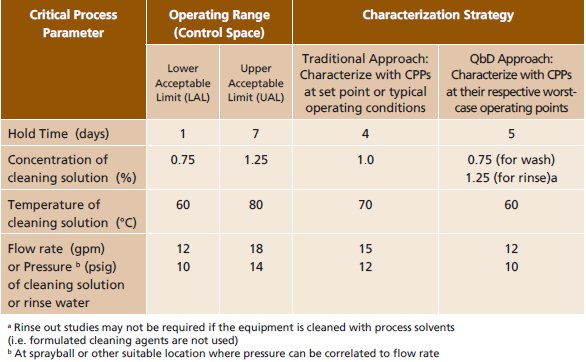
In this section we describe a QbD approach for the development of a robust cleaning cycle. As discussed earlier, a cleaning cycle is considered robust if it can consistently meet performance requirements under worst-case operating conditions. The worst-case operating conditions are identified through small-scale soilant characterization studies. In these studies, the relative cleanability of the process soil is evaluated by subjecting soiled coupons to simulated cleaning conditions [7-13]. The CPPs for these experiments are listed in Table 1. The first three CPPs, namely hold time and the concentration and temperature of the cleaning solution are varied within the design space (Figure 3). The fourth CPP, flow rate (Q), is set to simulate the worst-case fluid velocity in the equipment (VMIN). Typically, there is a very wide distribution of velocities within the equipment, ranging from over 150 cm/s in pipes and hoses, to under 10 cm/s in shadowed areas, such as the underside of an impeller. In order to simulate worst-case cleaning conditions at small scale, the average fluid velocity across the surface of the coupons (Vavg), is set to the worst-case (minimum) operating value for the equipment at full scale (VMIN). Typically, VMIN is on the order of 10 cm/sec for a well-designed process vessel. This estimate of VMIN is based on the average velocity of a gravity-induced drop of water along a 30° incline at 60°C [14]. Under these conditions, the Reynolds Number is less than 20, and the flow is laminar with negligible rippling [15-16]. Other important operating parameters such as material of construction, surface finish, soil-to-solution ratio, spotting volume, and drying rate are determined in accordance with full scale operating conditions.
Table 1 - Comparison of traditional and QbD approaches for cleaning characterization.
An experimental strategy for estimating the worst-case operating conditions is shown in Figure 3. The design space is delineated in rectangular coordinates for the three critical variables: hold time (1-7 days), temperature (60-80°C) and concentration (0.75-1.25%). The fourth critical variable, average velocity of the fluid across the surface of the coupon, is set to the worst-case operating value for the equipment (typically on the order of 10 cm/sec).
The small scale runs are executed in the following two stages:
Table 2 - Wash time as a function of hold time (Stage I data). The temperature and concentration of the cleaning solution are controlled at their respective set points (70°C and 1% in this case).
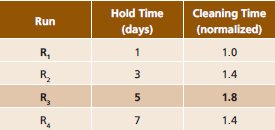
Stage I: In this stage the effect of hold time on relative cleanability is characterized. The temperature and concentration of the cleaning solution are controlled at their respective set points (70°C and 1%). The hold time is varied in increments of approximately 48 hours (e.g. 1, 3, 5 and 7 days). Depending on the rate of drying and chemical degradation of the soil, shorter increments may be necessary to adequately characterize the effect of hold time. The data are summarized in Table 2. The hold time at which the cleaning time is longest represents the worst-case hold time for cleaning.
Table 3 - Wash time as a function of temperature (Stage II data). The hold time is set to the worst-case operating value of 5 days (Table 2), and the concentration of the cleaning solution is controlled at the worst-case operating point of 0.75% (Table 1).

Stage II: In this stage the effect of temperature on relative cleanability is evaluated. The hold time is set to its worst-case operating value of 5 days based on data from Stage I, and the concentration is set to the worst-case operating point of 0.75% (Table 1). The temperature is varied between the upper and lower limits of 60 and 80 °C, respectively. The data are summarized in Table 3. The temperature at which the wash time is longest represents the worst-case temperature for cleaning.
The above seven-run experimental strategy can provide a reasonable estimate of the worst-case operating point within the design space. Additional runs could be performed to get a more precise estimate; however, for most applications the estimate obtained through this seven-run strategy is adequate for design purposes.
Setting the average fluid velocity under experimental conditions (Vavg) to the worst-case operating value for the equipment (VMIN) provides assurance that if the soil can be cleaned by the simulated wash at small-scale, then it can also be cleaned by the actual wash at full scale. This condition is valid only if, for the duration of the wash, there is adequate contact between the cleaning solution and the surface being cleaned. For CIP circuits, this condition is generally satisfied if the system is qualified to provide adequate spray coverage to the surfaces that need to be cleaned.
Table 4 - Worst-case operating conditions from cleaning characterization studies.
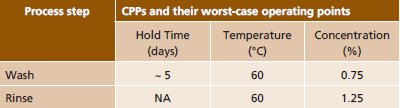
The ability of the system to meet the imposed performance requirements under the worst-case operating conditions is verified during cleaning characterization. Thus, when compared to the traditional approach, the QbD approach provides a higher degree of assurance that the process will meet the performance requirements if it is operated within the established control space (i.e. when the CPPs are within their respective acceptable limits). The worst-case operating conditions for the wash (5-day hold time, 60°C and 0.75%) and the rinse (60°C and 1.25%) based on the above seven-run experimental strategy are summarized in Table 4.
Conclusion
Quality by Design (QbD) provides a framework for implementing a systematic approach to process design, development and monitoring. The goal of QbD is to enhance robustness by building quality into the manufacturing process rather than testing it in. It also provides a structured framework for innovation and continuous improvement.
An important element of QbD is process characterization at small scale. The small-scale experiments are used to enhance process understanding and predict performance at full scale. The small-scale data can also be used to determine the worst-case operating conditions within the control space of the process. The ability of the process to consistently meet the performance requirements under the worst-case operating conditions is verified at small scale. The process is designed to minimize the operating ranges of the CPPs, and control strategies are developed to compensate for the variability of the process. Additionally, the process is continually monitored and modified, as needed, to assure consistent product quality over the lifecycle of the process. Thus, the QbD approach provides a higher degree of assurance that the product will meet the imposed performance specifications if the process is operated within its established control space.
Glossary
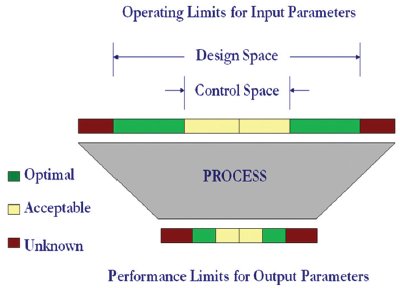
Figure 4 - Design Space and Control Space
Quality-by-Design (QbD): A systematic approach to product and process design and development.
Design Space: The multidimensional combination and interaction of input variables (e.g., material attributes) and process parameters that have been demonstrated to provide assurance of quality. Refer to Figure 4.
Control Space: A subset of the design space that defines the operating limits within which the process is controlled. Refer to Figure 4.
References
- US Food and Drug Administration: Guidance for Industry: Q 10 Quality Systems Approach to Pharmaceutical cGMP Regulations, Sept 2006. http://www.fda.gov/Drugs/GuidanceComplianceRegulatoryInformation/Guidances/default.htm
- Bert Frohlich: QbD: Still in Design? PDA Letter, Vol. XLIII, Issue #9, Oct 2007.
- Chi-wan Chen, Deputy Director ONDQA, CDER, FDA: A FDA Perspective on QbD: Regulatory Watch 2007 Conference, Robbinsville, NJ, Sept. 2007.
- Kourti, T., Quality by Design in the Pharmaceutical Industry: The Role of Multivariate Analysis, American Pharm. Review; p. 118-123, May/Jun 2009.
- Glodek, M., et al., Process Robustness—A PQRI White Paper; Pharm. Eng. 26 (6), 1-11, Nov-Dec 2006.
- Sharnez, R., Taking the guesswork out of validation; J. of Validation Technology, Vol 14, No. 3, p. 27-31, 2008.
- Sharnez, R., Leveraging Small-Scale Models to Streamline Validation; J. of Validation Technology, Vol 14, No. 4, p. 19-22, 2008.
- Sharnez, R., and Klewer, L., Parametric Release for Cleaning, Part I: Process Characterization; J. of Validation Technology, Vol 14, No. 8, p. 29-35, 2009.
- Sharnez, R., et al., In Situ Monitoring of Soil Dissolution Dynamics: A Rapid and Simple Method for Determining Worst-case Soils for Cleaning Validation; PDA Journal of Pharm. Sc. & Tech., Vol 58, No. 4, p. 203-214, July-Aug 2004.
- Canhoto, A., A Novel Bench Scale Apparatus to Model and Develop Biopharmaceutical Cleaning Procedures; J. of Validation Technology, Vol 11, Nov 2004.
- Pluta, P., Laboratory Studies in Cleaning Validation; Journal of Validation Technology, Vol. 13, No. 4, 2007.
- Hoist, B., Developing a Cleaning Process: Cleaning in Development; Journal of GXP Compliance, Vol. 10, No. 3, 2006.
- Sharnez, R., Emerging Concepts in Cleaning Validation, Part I – Streamline New Product Introductions with Master Soils; J. of Validation Technology, Vol. 15, No. 4, p. 24-29, 2009.
- Sharnez, R., Unpublished results.
- Bird, R., W. Stewart and E. Lightfoot, Transport Phenomena, Second Edition; John Wiley & Sons, p. 45-47, 2007.
- Kramers, H., and P. J. Kreyger, Mass transfer between a flat surface and a falling film; Chemical Engineering Science, Vol 6, p. 42-48, 1956.